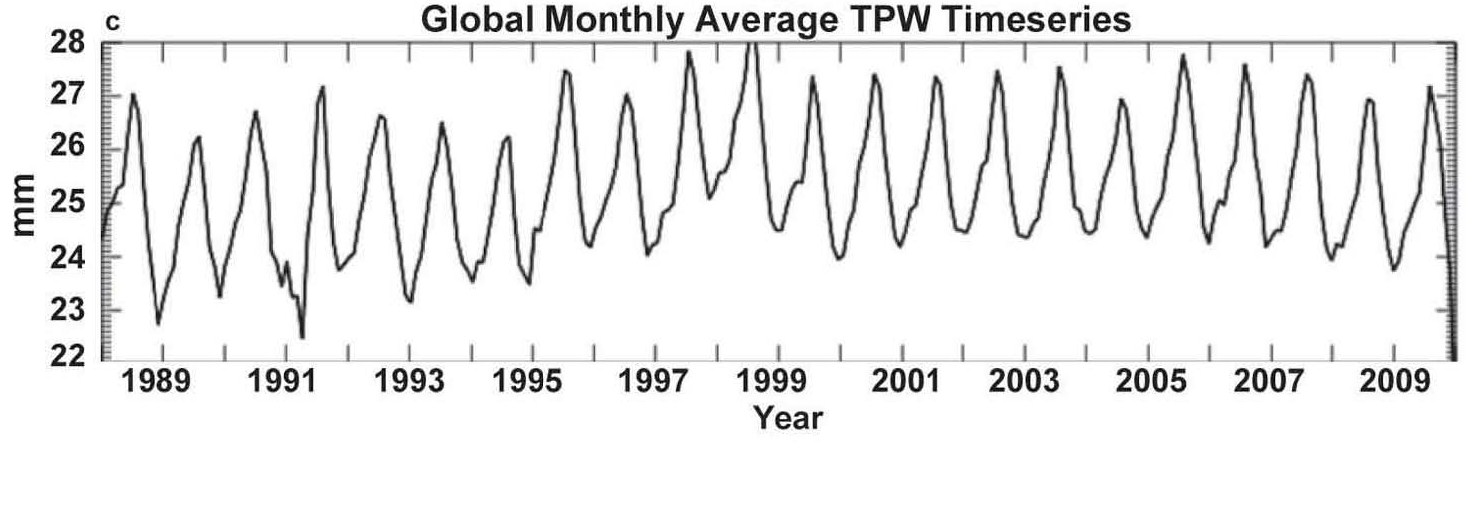
Roger Pielke sr. has an important blog article showing the latest results of NASA’s Water Vapor Project (NVAP). The graph above is the key figure in a new paper by Tom Vonder Haar, one of the principal investigators of NVAP. Now maybe the graph looks pretty dull to you, but the potential consequences of it are profound. This graph is showing the best measurements we have today of the total amount of water vapor in the global atmosphere (TPW = Total Precipitable Water vapor). As you can see, there is not much of a trend. Now this is not what is expected.
Remember, to get 3 degrees of warming by a doubling of CO2, climate models need positive feedbacks on top of the direct radiative effect of CO2. The main positive feedbacks are an increase of water vapor (itself a greenhouse gas) and clouds (mainly a decrease in low level clouds that reflect incoming solar radiation). This can be seen in the following figure from IPCC AR4:

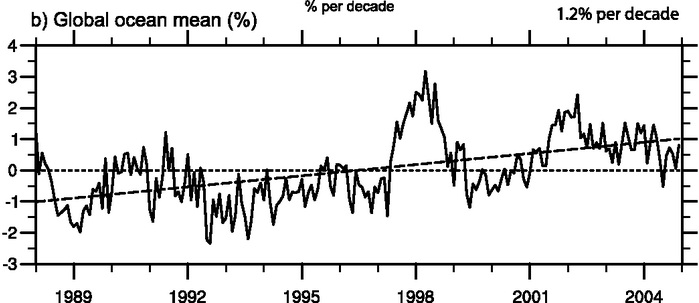
As you can see, by far the largest feedback in the models is water vapor (wv). AR4 suggested observational evidence for an increase in water vapor showing this graph:
The Summary for Policy Makers of AR4 concluded:
The average atmospheric water vapour content has increased since at least the 1980s over land and ocean as well as in the upper troposphere. The increase is broadly consistent with the extra water vapour that warmer air can hold.
Roger mentions a blog article I wrote last year after giving a presentation at the Dutch water institute Wetsus. That blog post shows a couple of very carefully worded statements by Vonder Haar throughout the last couple of years. In 2010 he wrote in the abstract for a conference:
By examining the 12 year record [1988-1999], a decrease of TPW at a rate of -0.29 mm / decade is observed. This relationship is significant at the 95 % but not at the 99 % level. A downward trend would be intriguing since there should be a positive slope if a global warming signal was present. However, by subdividing the data into two halves (1988-1993) and 1994-1999, trends with opposite signs are detected. Since the trend is not robust by subdividing the data, we conclude the global TPW has no significant trend from the NVAP dataset studied here.
In my blog post in April 2011 I also quoted an email of Tom Vonder Haar to me:
We have most definitely never said the preliminary NVAP data show a negative trend and anyone who does is making a false scientific statement.
All we can say at present is that the preliminary NVAP data, according to the Null Hypothesis, cannot disprove a trend in global water vapor either positive or negative.
In addition, there are good reasons based upon both Sampling / Signal Processing Theory and observed natural fluctuations of water vapor ( ENSO’s, Monsoons, volcanic events, etc. ) to believe that there are no sufficient data sets on hand with a long enough period of record from any source to make a conclusive scientific statement about global water vapor trends.
Now given the above statements about lack of trends the new results are not unexpected, but still very important. Vonder Haar is still very careful about the results writing at the end of the paper:
The results of Figs. 1 and 4 (note Fig. 4 is the figure at the top of this post) have not been subjected to detailed global or regional trend analyses, which will be a topic for a forthcoming paper. Such analyses must account for the changes in satellite sampling discussed in the supplement. Therefore, at this time, we can neither prove nor disprove a robust trend in the global water vapor data.
The paper itself – excuse the pun – is very dry. It’s just a description of the new NVAP dataset. So we will have to wait for more papers based on this dataset. The deadline for AR5 is in two weeks. It will be interesting to see what they make of this new dataset and the prove or disprove of a robust trend in water vapor.
Leuke grafiek, met een beetje fantasie (!) zie je er de sterke temperatuurstijging tot rondom 2000 en een afvlakking daarna (i.e. tussen 2000 en 2009), gecombineerd met/ versterkt door een El Nino signaal. Toch vraag ik me af in hoeverre je iets kan zien in deze grafiek en in hoeverre de onzekerheden en of ruis niet veel hoger zijn dan het signaal. Voor elke graad temperatuurstijging neemt de hoeveelheid vocht in de atmosfeer (Clausius Clapeyron) met ongeveer 7 % toe. Aangezien de PW in de grafiek ongeveer 25 is, zou dit een stijging zijn van 1.75, en met moeite zichtbaar… Lees verder »
Arjan, allemaal terechte punten, het bekende verhaal van signaal en ruis. Maar zet deze nuanceringen eens af tegen de toch wel stelligheid die in AR4 werd geetaleerd op een nog kortere reeks die bovendien alleen voor de oceanen gold.
Ik neem derhalve aan dat jij de passage uit de SPM niet voor je rekening zou nemen?
Marcel
Misschien een gekke vraag, maar waarom loopt die bovenste grafiek niet door tot 2012? Ik zou El Niño-jaar 2010 er bijvoorbeeld wel tussen willen zien staan.
Neven, geen idee, maar het zal niet zijn om zo laag mogelijk te eindigen. Ze zijn al een paar jaar bezig met deze dataset. Het is de belangrijkste dataset voor waterdamp dus vroeg of laat zal ‘ie ongetwijfeld geactualiseerd worden.
Hi Marcel,
Is there an easy way to translate comments from Dutch to English other than one by one in Google Translator, say?
Bill
BillC, I asked around but am afraid there is no way to do this; sorry
Marcel