
Yesterday I was keynote speaker at a one day conference in Leeuwarden, organised by the water technology institute Wetsus. First I want to thank the two directors of Wetsus, Cees Buisman and Johannes Boonstra, for giving me the opportunity to present my view on the global warming debate. Next, they gave each of the 150 participants a copy of my book. By doing this they greatly support the kind of research I have been doing over the past three years and hope to be doing in the next few years. This kind of support makes it possible to stay independent as a journalist and do investigative reporting.
As most of the participants are working in the water business (waste water treatment, drinking water etc.) I decided to concentrate my lecture (my PPT is available here) on the role of water in the climate debate. This turns out to be quite interesting because the global warming debate is more about the role of water than about the primary radiative effect of CO2, which is well understood and accepted by all parties.
The main issues remain that a theoretically expected warming from CO2 does not mean that the recent warming (1980-now) is caused by CO2, that there seems to be no global warming in the oceans in the last decade, that most of the future warming in the models is coming from water vapor and cloud feedbacks but that currently the observational evidence for these feedbacks is not yet very strong, let alone evidence for a net positive feedback.
As half of the participants were not Dutch my presentation was in English. For many slides I didn’t provide the sources so I will use this post to give some background and sources for my talk.
The picture in slide 4 is coming from this recent blog post of Jeff Condon, which was also picked up by Roger Pielke sr. here. The simple point is that the energy content of the oceans is about 1000 times larger than that of the atmosphere and therefore that we should diagnose global warming in the oceans and not on land with the problematic surface temperature measurements.
Acceleration of global warming?
I then showed some examples of Lucia Liljegren’s latest comparisons of models vs observations making the point that global warming lately is decelerating and not accelerating. After the talk a PhD student of Wetsus ran in front, grabbed the microphone, complained that I cherry picked, and showed the GISS results instead of the HadCrut results that I showed. For him, here are the results for GISS: http://rankexploits.com/musings/2011/giss-march-anomaly-rose-to-0-57c/ He is right, GISS is doing slightly better than HadCrut, but still far away from what the models are showing. I pointed him to chapter 2 of my book which gives all the details about the problems with the surface temperature measurements.
As sea level rise is a big issue for The Netherlands, I also used a plot from World Climate Report, showing that the trend in the satellite data is decreasing, which fits with other data we have from the oceans, e.g. both SST and Ocean Heat Content data.
I then explained that we should use Ocean Heat Content (slide 11-13) as the metric to diagnose global warming (or cooling). The plot is coming from Pielke sr. again, and he got it from Josh Willis. Pielke explains here why the diagnosed 0.2 W/m2 is lower than expected.
Water vapor feedback
I introduced the concept of feedbacks to my audience (many of which had PhD’s but not in the field of climate science) and showed this IPCC figure. Water vapor is the main positive feedback in the models. It is intuitively very plausible because warmer air can in theory hold more water vapor. IPCC was quite confident in AR4 that water vapor is a positive feedback (slide 19). However more sceptical scientists like Roy Spencer here and Roger Pielke here keep pointing to counter arguments and evidence for a lack of a positive trend on a regional scale (here and here).
The IPCC figure showing a rise in water vapor content is based on a paper by Kevin Trenberth which is online here. Recently Trenberth published a similar paper on water vapor and precipitation but the earlier figure which showed the period 1988-2004 was not updated. Other datasets like AMSR show no change in water vapor concentration in the last decade. So this makes the trend in the IPCC graph (which was 1.2% per decade, based on 17 years) smaller.
There are other data sets, for example the NVAP data set of Nasa, that so far show no trend in water vapor since 1988. Pielke sr. again picked this up on his blog last year. He highlighted this quote of Tom Vonder Haar who is involved in this data set:
By examining the 12 year record [1988-1999], a decrease of TPW at a rate of -0.29 mm / decade is observed. This relationship is significant at the 95 % but not at the 99 % level. A downward trend would be intriguing since there should be a positive slope if a global warming signal was present. However, by subdividing the data into two halves (1988-1993) and 1994-1999, trends with opposite signs are detected. Since the trend is not robust by subdividing the data, we conclude the global TPW has no significant trend from the NVAP dataset studied here.
I found an AGU presentation about the NVAP dataset by Janice Bytheway, who is working in the Vonder Haar group in Fort Collins. (google her name and it comes up high in the list). She is showing this figure, with the disclaimer that it’s still work in progress:
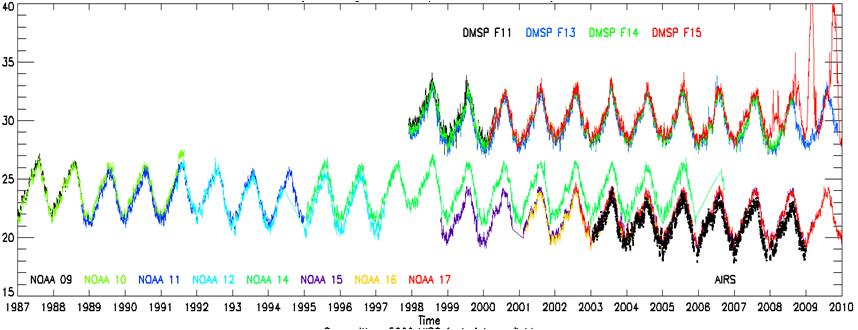
The upper series is for oceans only, the lower for ocean/land combined. See her presentation for more details. They didn’t say anything about trends so I decided to contact Tom Vonder Haar who sent the following reply:
We have most definitely never said the preliminary NVAP data show a negative trend and anyone who does is making a false scientific statement.
All we can say at present is that the preliminary NVAP data, according to the Null Hypothesis, cannot disprove a trend in global water vapor either positive or negative.
In addition, there are good reasons based upon both Sampling / Signal Processing Theory and observed natural fluctuations of water vapor ( ENSO’s, Monsoons, volcanic events, etc. ) to believe that there are no sufficient data sets on hand with a long enough period of record from any source to make a conclusive scientific statement about global water vapor trends.
I believe discussion and informed speculation is healthy for Earth System Science when properly reported. As you know the most recent IPCC assessment went into considerable detail about Uncertainty and I support even more of this work. It helps focus our scientific attention on key areas where improvements should and can be made.
Water vapor variability and feedback is one such area and that is the reason for the Re-analyses and improvements to the NVAP data set. We are planning first release and discussion of our new results of NVAP-M ( sponsored by the NASA MEaSUREs research program ) at the World Climate Research Programme Science Conference in Denver, CO in October, 2011. That will begin a period of more than one year wherein we will intercompare the NVAP-M results with independent estimates by colleagues in both the US and international community. The checks and balances provided by such a collaborative effort should then produce a credible statement about our rapidly increasing knowledge of variability and trends of water vapor.
Now although of course he is very careful – as most scientists are – these statements are far less certain about the observational evidence for a positive water vapor feedback than IPCC was in AR4. There they wrote in the Summary for Policy Makers:
The average atmospheric water vapour content has increased since at least the 1980s over land and ocean as well as in the upper troposphere. The increase is broadly consistent with the extra water vapour that warmer air can hold.
Now this of course sounds much more certain than the remark of Vonder Haar that ‘there are no sufficient data sets on hand with a long enough period of record from any source to make a conclusive scientific statement about global water vapor trends’. So I think we all look forward to hear more about this important data set next October in Denver.
Precipitation and extreme precipitation
In the final part of my talk I concentrated on precipitation and extreme precipitation which was recently in the news after two Nature papers claimed to have found a link between greenhouse gases and extreme precipitation. I wrote a cover story for the Dutch NWT Magazine (see slide 28 for the nice cover picture) which will be available in the book stores next week. For this article I looked at a lot of trends series for precipitation and extreme precipitation.
The Greek hydrologist Demetris Koutsoyiannis showed me this graph based on the GPCP project:
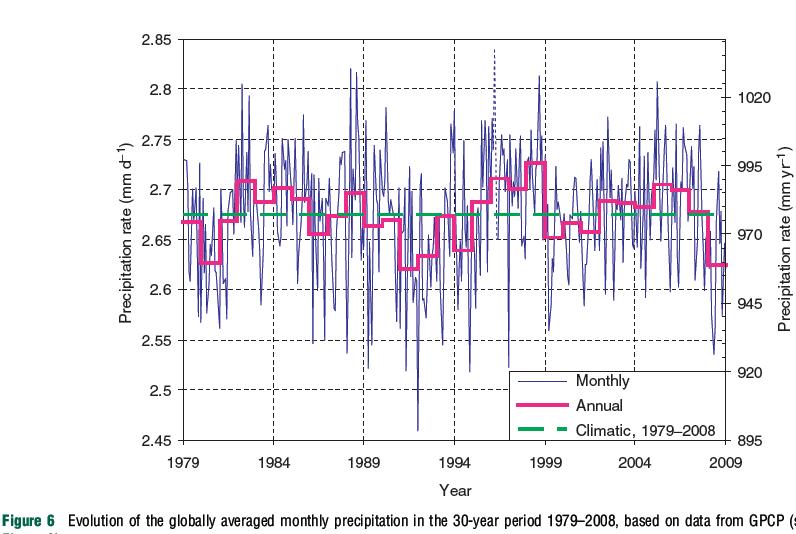
As you can see there is no trend in global precipitation. When we look at extreme precipitation, there is an increasing trend in The Netherlands since 1950, mainly near the coast (slide 32, based on data from http://eca.knmi.nl/). However if you look at the longer time series of KNMI in De Bilt, there is no trend.
Koutsoyiannis recently presented an analysis about trends in extreme precipitation at the EGU conference concluding that especially since 1970 there is no trend at all. Also at EGU he showed that models underestimate extreme rainfall for some stations around the Mediterranean up to a factor of ten. This poses serious questions about the attribution study of Zwiers and coauthors in Nature, who used climate models to conclude that CO2 already contributed to an increase in extreme precipitation. An increase by the way that was not confirmed by the recent analysis of Koutsoyiannis. The dreary state of precipitation in climate models was also confirmed by Graeme Stephens who stated in his paper:
these models produce precipitation approximately twice as often as that observed and make rainfall far too lightly
All in all it was really interesting to look so deeply into the role of water in the global warming debate. Very little seems certain. Even the so obvious positive water vapor feedback is hard to find in the observations. There seem to be no trend in either total or extreme precipitation.
Given these sober facts about precipitation it’s no surprise that Koutsoyiannis found no trend in floods worldwide either.
Now does this all mean that CO2 is not a serious issue to look at? No of course not. It does show though that in an era, that Paul Crutzen has dubbed the anthropocene, the hydrological cycle does not seem to behave in a different way yet. Right now we cannot say there is more water vapor due to global warming, more rain due to global warming, more extreme precipitation due to global warming or more floods due to global warming. That’s pretty sobering in a media world where almost every flood is connected to global warming.
That’s pretty sobering in a media world where almost every flood is connected to global warming.
Strawman.
Ha Neven, kun je het trollen niet laten? En wat klopt er volgens jou niet aan: “Right now we cannot say there is more water vapor due to global warming, more rain due to global warming, more extreme precipitation due to global warming or more floods due to global warming.” Nou? En dan mag een terechte opmerking als deze: “That’s pretty sobering in a media world where almost every flood is connected to global warming.” volgens jou niet gemaakt worden? Pathetisch. Ja jongen, de feiten zijn hard. Get used to it. The game is over. CAGW is dead as a… Lees verder »
CAGW is dead as a doornail.
1. Wishful thinking.
2. Er is nog wel wat meer aan de hand dan AGW alleen.
1. nee, de keiharde feiten.
2. ja inderdaad, de teloorgang van een macabere linkse poging de wereld naar haar hand te zetten.
Beste Marcel, Waarom laat je zo veel korte tijdseries zien, terwijl er veel meer lange termijn observaties beschikbaar zijn? Met uitzondering van slide 5 laat je vooral de laatste 10 jaar zien… Gemiste kans, en erg vertekenend. Trends in korte reeksen waarnemingen zeggen erg weining. Met name je slide 11 is simpelweg misleidend. Inderdaad, ocean heat content van de laatste 5 jaar laat weinig opwarming zien… Vandaar dat je naar de laatste 50 moet kijken. Dit weet je zelf natuurlijk ook wel. Toch doe je het niet. NOAA heeft een goede compilatie gemaakt van verschillende reeksen data die voor iedereen… Lees verder »
@Marcel, je trekt al weer de nodige klimaatfanatici aan zie ik, die je van allerlei vreselijks beschuldigen. Jammer van het debat
. Wat me wel brengt bij een volgende vraag: hoe verhoudt de afwezigheid van een trend in precipitatie zich tot de aanname aan sceptische kant over negatieve feedbacks in het klimaatsysteem tav afvoering van extra energie, juist door het ontstaan van neerslag. Dat zou dus ook betekenen dat die negatieve feedback is overschat, of zeg ik dan iets heel geks?
Uiteindelijk ben ik ook maar van de bloemetjes en de bijtjes en een simpele kerel
Ha Rypke, je hebt de klok horen luiden, zullen we maar zeggen :) Maar je roert wel een belangrijk punt aan, waar Rob van Dorland ook op zit. Volgens de modellen zullen waterdamp en wolken een positieve feedback opleveren. Dat wil zeggen, die veranderen op zo’n manier bij een hogere CO2-concentratie dat ze tot extra opwarming zullen leiden. De lapse rate feedback is de belangrijkste negatieve feedback in de modellen. Dat is waar jij hier op doelt. Een deel van de warmte wordt afgevoerd omhoog via convectie en kan hoog in de atmosfeer uitstralen. Deze drie processen (waterdamp, wolken en… Lees verder »
Precies, en daarom is en blijft de water vapor feedback een belangrijke onzekerheid in onze huidige kennis van het klimaatsysteem! Trends in aerosolen en global radiation (surface (solar) radiation) kunnen ook weer leiden tot veranderingen in de hydrologische cyclus. Ik zou dus voorzichtig zijn met concluderen “it’s worse than we thought” of andersom, met dat het allemaal wel mee zal vallen. Het is een gigantische puzzel, met een onbekend (maar schijnbaar oneindig) aantal stukjes. De stukjes hierboven zijn slechts een piepklein gedeelte van alle (belangrijke) interacties in de hydrologische cyclus. Het netto effect hiervan is onmogelijk te beredeneren, en kan… Lees verder »
Hi Arjan,
Dank voor je bijdrage aan de discussie. Ik ben het eens als jij schrijft: “Precies, en daarom is en blijft de water vapor feedback een belangrijke onzekerheid in onze huidige kennis van het klimaatsysteem!”
Maar kijk wat het PCCC schrijft in reactie op mijn boek http://www.klimaatportaal.nl/pro1/general/start.asp?i=0&j=0&k=0&p=0&itemid=983
“Een hogere temperatuur leidt bijvoorbeeld tot meer waterdamp in de atmosfeer. Waterdamp is zelf ook een broeikasgas en versterkt het effect van meer CO2: een positieve terugkoppeling.”
Het is deze stelligheid van IPCC en in NL het PCCC die ik met mijn lezing wilde nuanceren.
gr Marcel
Marcel, de grafiek van Koutsoyiannis die je laat zien geldt voor de hele wereld. Je gebruikt dit als ontkrachting van een van de Nature-papers waar je naar linkt. In die paper kijkt men echter niet naar wereldwijde trends, maar naar de “recent increases in the intensity of heavy precipitation events over a large part of the Northern Hemisphere land area“. Wist je dit?
Neven, ja dat wist ik, zie verder NWT Magazine van deze maand voor meer achtergrond. Je zoekt spijkers op laag water.
Dat kan zijn, maar dat water wordt wel steeds hoger.
Neven,
Dat komt dan in ieder geval niet door extra neerslag :)
A propos: hou je een beetje bij wat er allemaal in de VS aan de hand is? Het schijnt dat de Mississippi op het punt staat spectaculaire dingen te doen. Ze overwegen om een dam op te blazen en dan komt heel wat landbouwgrond onder water te staan. Potentieel de grootste overstroming sinds 1927. Het houdt maar niet op met al die mega-overstromingen wereldwijd.
Maar misschien valt het wel mee.
Hier een artikel van CNN over de Mississippi-crisis. The crisis is centered on the stretch of the Mississippi River between Memphis and St. Louis, but it relates to a far broader issue of excess water in the river and its tributaries. Engineers have warned that should the rising waters of the Mississippi River overwhelm the entire flood control project, it could deluge cities, destroy crops, destroy businesses and paralyze river transportation. Engineers already have reported sand boils and seepage at a number of levees near the confluence of the Ohio and Mississippi rivers, a condition that Walsh said also threatens… Lees verder »
Beste Marcel, Even een korte reactie op een aantal punten die in jouw verhaal en de discussie naar voren komen. 1. Jij schrijft: ‘I pointed him to chapter 2 of my book which gives all the details about the problems with the surface temperature measurements.’ Het zou goed zijn als je deze persoon verwijst naar onze reactie op het klimaatportaal omdat we daar uitgebreid uiteen zetten wat het probleem is met jouw hoofdstuk 2 (zie . Tevens wil heb ik je onlangs gewezen op de recente publicatie van Watts en Pielke (25 maart 2011, JGR) waarin hij aangeeft dat de… Lees verder »
Hoi Bart
ik kan me voorstellen dat je ongeduldig werd, dat werd ik ook in de 5 maanden dat ik moest wachten op jullie reactie :)
Ik kom er echt de komende weken op terug en wel voor mijn vakantie die 11 juni in gaat.
Een eerste reactie op punt 2, lees http://www.pas.rochester.edu/~douglass/papers/KD_InPress_final.pdf eens, dan zie je hoe von Schuckmann 2009 toch wel uit de toon valt.
Pielke heeft een blogbericht gewijd aan de 0,77 W/m2:
http://pielkeclimatesci.wordpress.com/2009/12/23/further-comments-on-the-inadequate-epa-response-to-reviewer-comments-on-ocean-heat-content/
Marcel,
In het abstract van die paper waar je naar linkt (Knox and Douglass) staat: “Using only 2003–2008 data from Argo floats…”
nuff said.
“Using only the yesterday’s and today’s temperatures, it looks like we’re in a cooling trend”
Zie voor een overzicht van de bomen en het bos bijvoorbeeld
http://www.skepticalscience.com/Climate-cherry-pickers-cooling-oceans.html
@Bart Verheggen
Dit is wel een heel vreemde reactie van je; ik reageer namelijk op http://www.klimaatportaal.nl/pro1/general/start.asp?i=0&j=0&k=0&p=0&itemid=945 waar jullie verwijzen naar Von Schuckmann 2009 om aan te geven dat er wel degelijk opwarming is in de periode … 2003-2008.
Uiteraard is 6 jaar kort maar aangezien het hier over OHC gaat is het wel degelijk interessant. Een positive radiative forcing zou ieder jaar moeten leiden tot een accumulatie van warmte. Tenzij er natuurlijk negatieve feedbacks werkzaam zijn…
Marcel
Marcel,
Je hebt een punt, mijn reactie was wat te snel en scherp neergepend.
Wat echter nog steeds overeind staat is dat hoe meer data je bekijkt (in de tijd of in de zeediepte), hoe duidelijker het is dat de warmteinhoud vd oceanen gestaag toeneemt (natuurlijk met natuurlijke variatie daarop gesuperponeerd). Dat is het bos waarop ik me probeer te richten.
Het is trouwens wel ironisch dat je als argument gebrukikt dat Schuckmann 2009 “toch wel uit de toon valt”. Dat heeft veel weg van een consensus argument, waar je normaal gesproken juist zo op afgeeft.
Hi Bart, Josh Willis is degene die het dichtst op de ARGO data zit en Roger Pielke vraagt hem geregeld naar een update. Dit is de laatste: http://pielkeclimatesci.wordpress.com/2011/02/13/update-of-preliminary-upper-ocean-heat-data-analysis-by-josh-willis-%E2%80%93-%E2%80%9Can-unpublished-update%E2%80%9D/ http://pielkeclimatesci.wordpress.com/2011/02/07/where-is-the-missing-argo-upper-ocean-heat-data/ Dus met de diepe oceaan erbij zo’n 0,25 W/m2, aanzienlijk lager dan Von Schuckmann. En dat is dan een reeks die eindigt op een El Nino piek, dus ik ben benieuwd waar we na de La Nina staan. Kan wel eens dicht bij nul zijn. Knox en Douglass noemden Von Schuckmann 2009 in hun paper een ‘outlier’ en daarom sprak ik van ‘valt uit de toon’. Ik ben overigens niet perse… Lees verder »