Recently I gave my first Tedx talk during Tedx Roermond. Roermond is a city in the south of The Netherlands. The experience was quite interesting. The motto of Ted is “ideas worth spreading”. Apparently not all ideas are worth spreading, because soon after the organisation of Tedx Roermond sent my name and a short description of my ideas to the TED headquarters they received a rather threatening email back that the ultimate consequence could be that they would lose their Tedx license. Kudos to the organisation of Tedx Roermond that they persisted in scheduling my talk and also in uploading it.
The talk is online, however with the following note from TED:
“NOTE FROM TED: We’ve flagged this talk, which was filmed at a TEDx event, because it appears to fall outside TEDx’s curatorial guidelines.The sweeping claims and assertions made in this talk regarding climate change only represent the views of the speaker and are not corroborated by scientific evidence.”
This – “The sweeping claims” – is all rather amusing.
In preparing my talk I wrote down what I wanted to say. That version (not a transcript) differs of course from the final talk I gave in Roermond. The talk is meant to be understandable for a broad audience. Below is the written version of my talk.
Tedx speakers are not allowed to be given a speaking fee, so you have to do all the preparation in your own time. If people appreciate the talk they might consider using the donation button. Thanks!
Marcel Crok, Amsterdam, The Netherlands
Tedx Roermond, Marcel Crok, December 14, 2018
I am going to talk about two different worlds today, the world of history and the world of the future. In the world of the past we can measure, observe, count, archive etc. The world of the future we can explore by guessing, by extrapolation and by modelling.
I studied chemistry, I then decided to become a science journalist. Late 2004 the editor in chief of the popular science magazine I worked for asked me to look into the famous hockey stick graph. [slide 1]
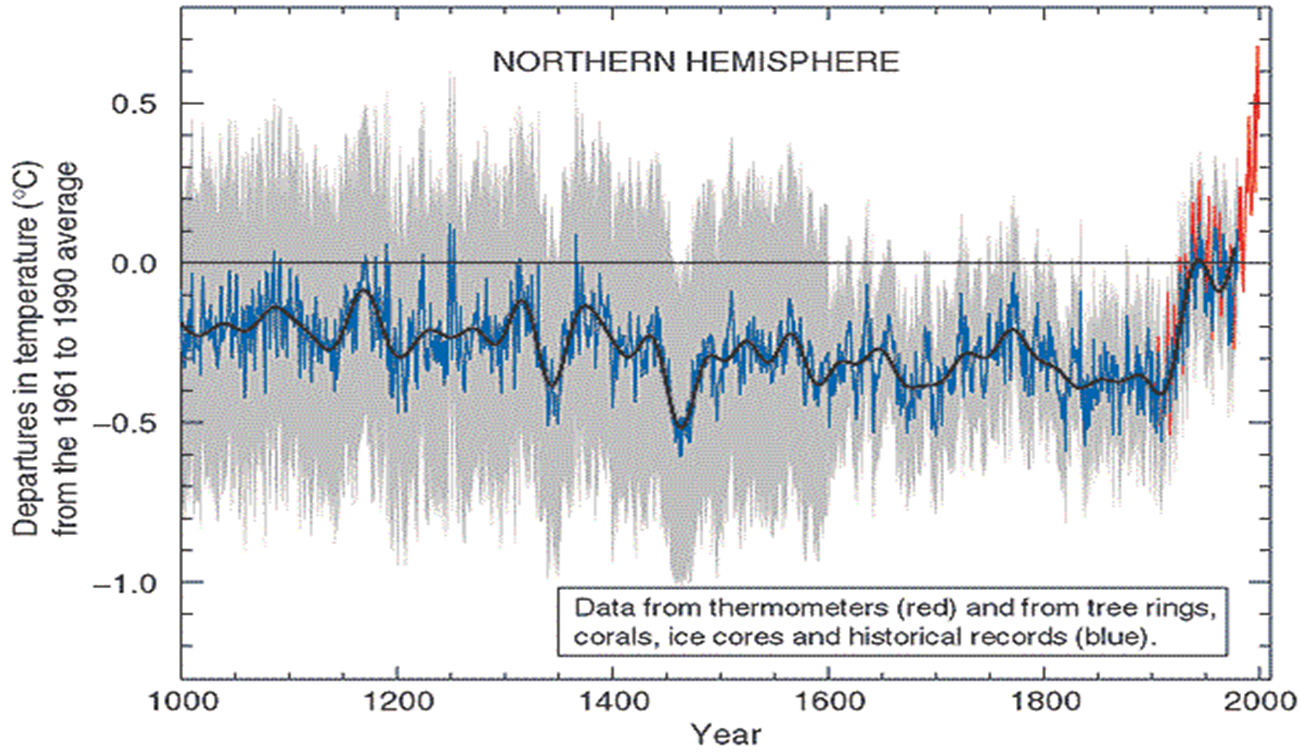
Slide 1: the original hockey stick graph, Mann et al. 1998.
I had never written about global warming, so it was my first article on the topic.
This graph played a very prominent role in the third IPCC report and was displayed six times in the report.
The graph shows a reconstruction of the temperature, based mainly on tree rings and other climate indicators, on the Northern Hemisphere since the year 1000. It suggests the temperature didn’t vary much for centuries until 1900, and then accelerates. What is so special about 1900? It is the period we are starting to use fossil fuels and therefore emitting CO2.
I did what science journalists do in such a case, I delved into the story. Two Canadians, both ‘outsiders’, had done a lot of audit work on the graph and I decided to contact them. Their story was fascinating and after two years of struggling they found out what was wrong with the graph. They discovered there was a crucial error in the statistics. As a result, even if you used computer generated noise, the hockey stick curve would appear.
They published this in a scientific paper and I had the scoop of their work in the media. We translated the article and published it both in our own magazine Natuurwetenschap & Techniek as in the Canadian newspaper the Financial Post.
It was my first article on climate change ever and right away I was in the middle of not only the Dutch climate debate but even the international debate. The article won an award, but I was also criticized, by KNMI for example, who said publicly my article was “nonsense”. I was also immediately branded as a “climate sceptic”, even by fellow science journalists.
The arguments of the critics were not difficult to refute and the work of the two Canadians stands firmly to this day. I was intrigued by the quite aggressive and also defensive reaction of the climate scientists. Up to this day the criticism of the Canadians has never been fully addressed by the climate science community or the IPCC. Wasn’t this about the progress of science?
I think if climate scientists in The Netherlands and abroad had accepted the criticism of the two Canadians and had corrected their graph, I would have moved on to other topics. But now I became really fascinated and also persistent. If climate change is supposed to be so important, but the science seems to lack self-correction, what about other claims in the climate debate? I decided to quit my job and work fulltime on the climate issue and I have done so ever since.
A broken hockey stick graph doesn’t mean that global warming can’t be a problem. So, let’s look at the evidence.
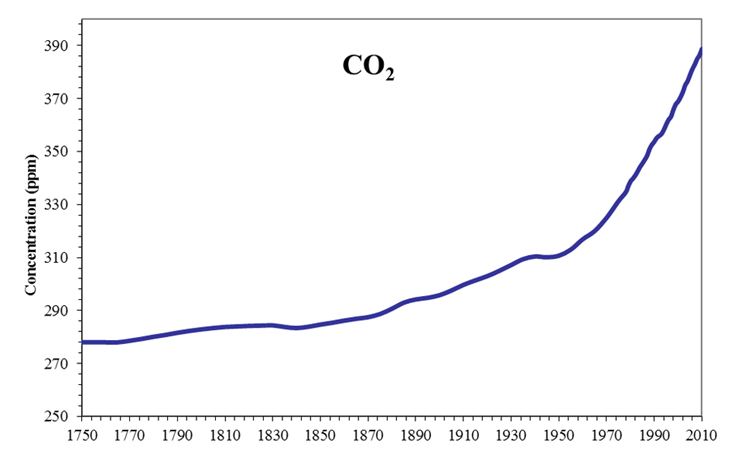
At first sight the evidence is pretty convincing. CO2 is a greenhouse gas and therefore has a tendency to warm up the planet. Is CO2 increasing? Yes. [slide 2]
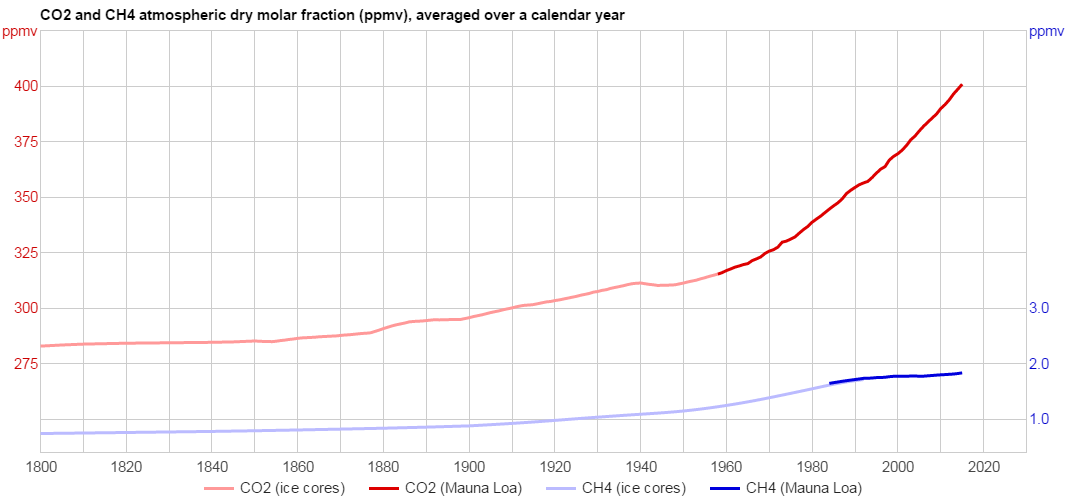
Is this caused by burning fossil fuels and other human activities? Although some scientists still question this, I would say yes.
Is the earth warming? Absolutely [slide 3].
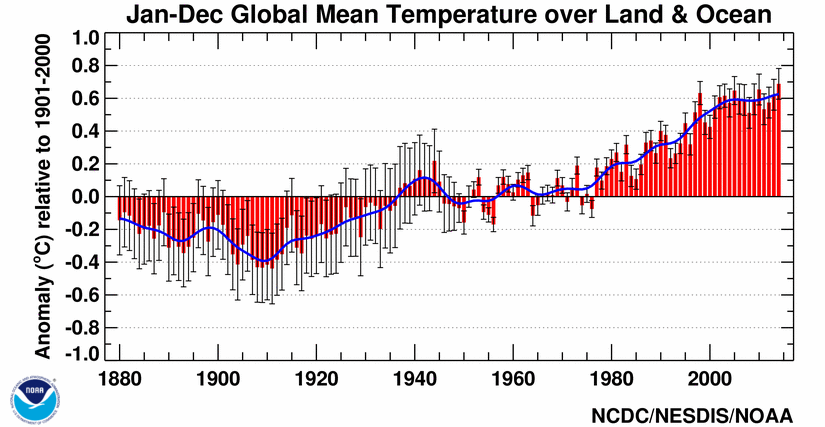
Now comes the hard part. Correlation doesn’t prove causation. How do we know that the increase in CO2 caused the recent warming? Well, we don’t know. It’s fair to say that the IPCC claims it is most likely that all the warming is caused by greenhouse gases. But there is no way to prove this in a way you prove Newton’s law [slide 4] for example.
We only have one earth and you cannot do repeated experiments with it, like with Newton’s apples falling from a tree. We can only observe the changes that have taken place and try to make sense of them and that’s what climate scientists do. But this approach has limitations.
The IPCC feels pretty certain – they call it extremely likely – that most of the warming since 1950 is caused by CO2 and other greenhouse gases. The evidence for this claim comes mainly from simulations with climate models. Climate models are huge computer programs that try to simulate the whole climate. It’s quite an accomplishment of the science community, and IPCC nowadays uses the results of around 30 models. These model simulations show that if you don’t use greenhouse gases, the models can’t replicate the warming since the mid seventies till now. [slide 5]

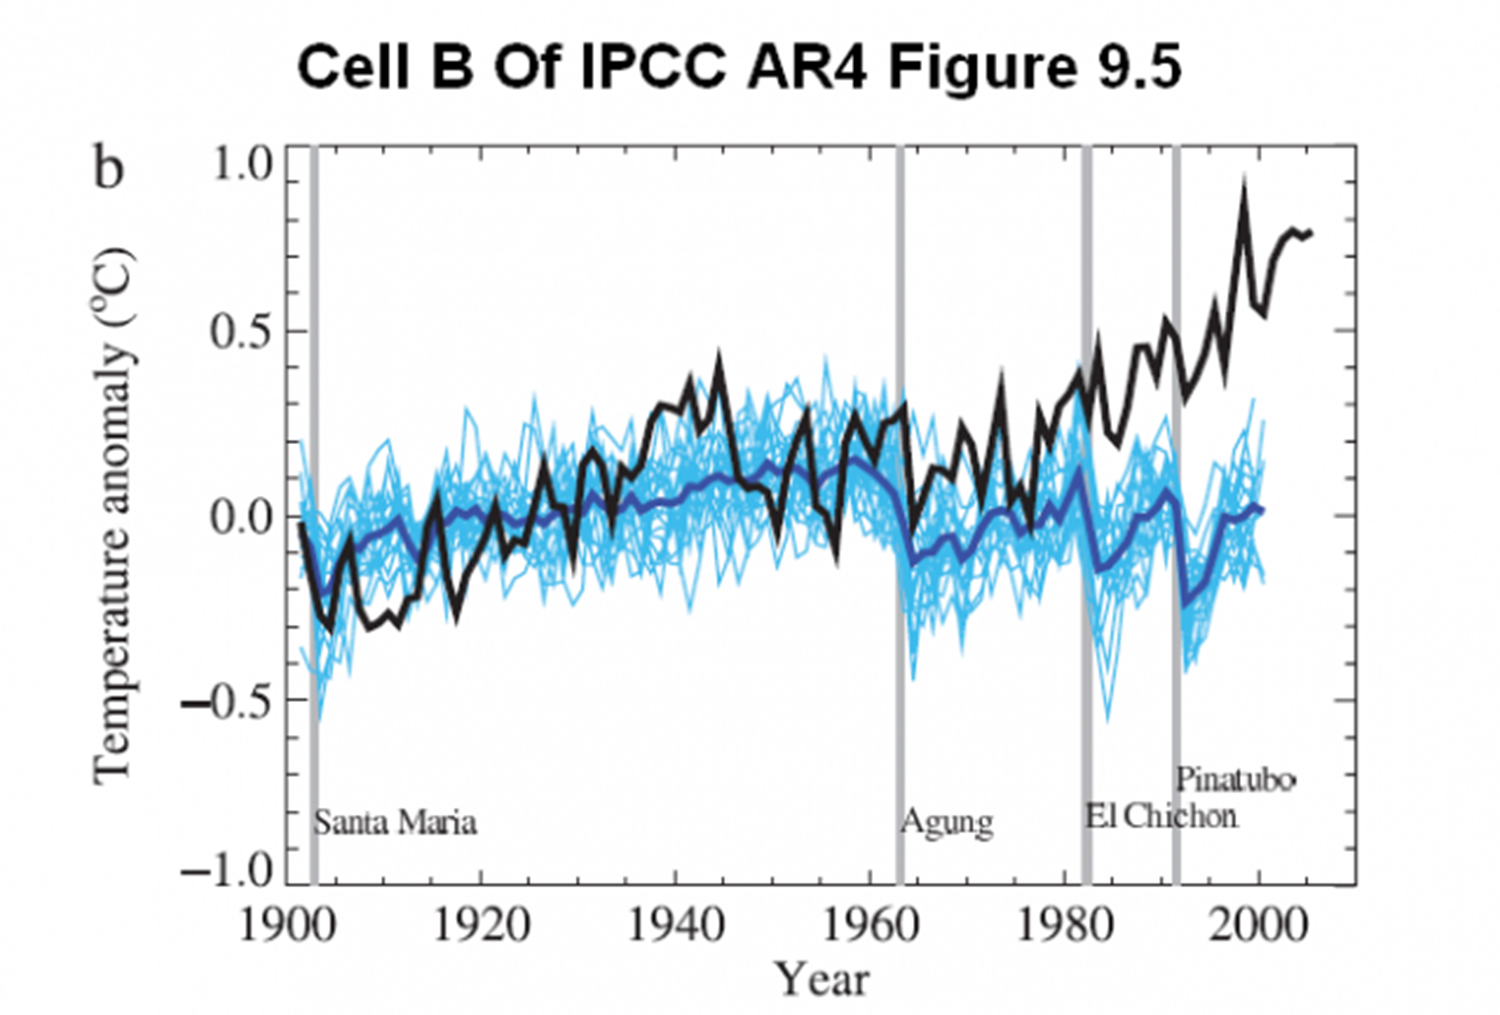
Slide 5: GCM simulations with only natural forcings (right) and all forcings (left). Source: IPCC AR4 report.
The figure on the right shows what happens if you use only natural influences in the models, mainly changes in the sun and volcanic activity. The models can’t replicate the recent warming. With both natural and anthropogenic factors (figure left), the models do – at first sight – a very reasonable job to replicate the recent warming. The evidence of the IPCC can thus also be expressed as: our models can only explain the recent warming with CO2 and other greenhouse gases.
However, if you look carefully in the next panel [slide 6] you see it mentions an early warming period between 1915 and 1945.
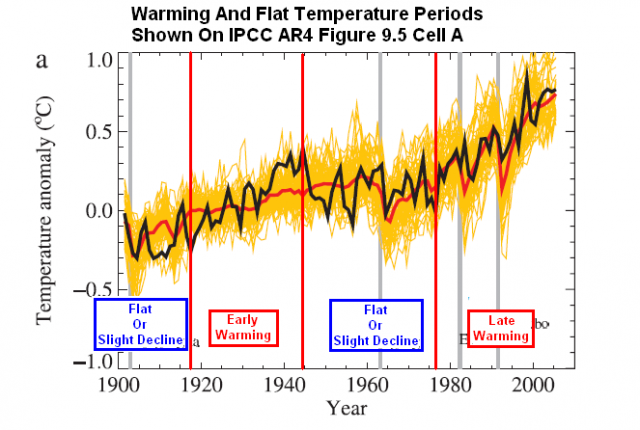
Source: https://wattsupwiththat.wordpress.com/2015/04/16/climate-naysayers-are-giving-climate-skeptics-a-bad-name/ (IPCC graph annotated by Bob Tisdale)
The models, represented by the thick red line, are not able to replicate this early warming that was of about the same magnitude as the warming between 1975 and 2000. So the same models that are used to ‘prove’ that humans caused the recent warming fail to reproduce a warming period earlier in the century. This of course weakens the evidence.
What is going on here? There still is no clear explanation for the early warming period and IPCC reports say very little about it. A logical candidate is what scientists call the Atlantic Multidecadal Oscillation [slide 7], the AMO.
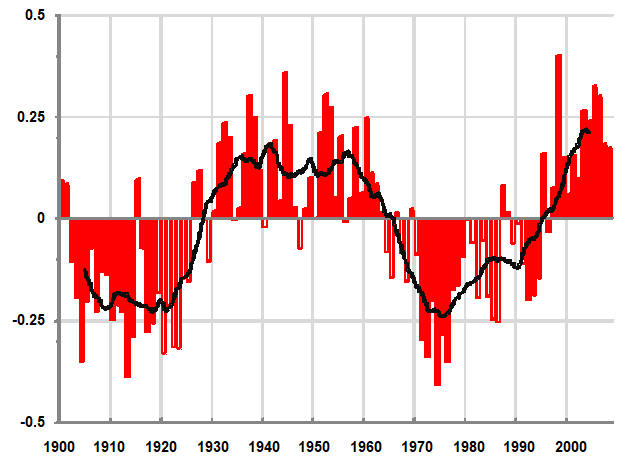
Slide 7: the Atlantic Multidecadal Oscillation index.
It’s a quasi-periodic warming and cooling phase of the Atlantic Ocean that influences global temperature. The AMO’s influence is evident in the pattern of global temperature changes. So, it contributes to the warming in both the early and the late warming periods. However, climate models are unable to capture this behaviour. And scientists are still uncertain what causes the AMO.
Now here is what according to me has happened. The climate modellers of course try to replicate historical changes in the Earth’s global temperature because this has become the main indicator for global warming and is a key measure used to judge their models. They manage to simulate both the recent warming and the lack of warming in the middle of last century with a combination of greenhouse gases and aerosols, which are air pollutants. However, both the mid-century flat temperature and the late century warming were partly caused by natural oscillations of the climate system. So, the models more or less replicated the post-1950 global temperature record, but for the wrong reasons.
In order to get more confidence in the models, it helps if they do well when they predict the future. Unfortunately, the climate models don’t do so well in this respect. If we take the period since 1979, the so-called satellite era, climate models already overestimate the observed warming by about 30 to 35%, despite part of the observed warming likely being caused by the AMO upswing. The difference is even larger in the tropical troposphere. [slide 8]
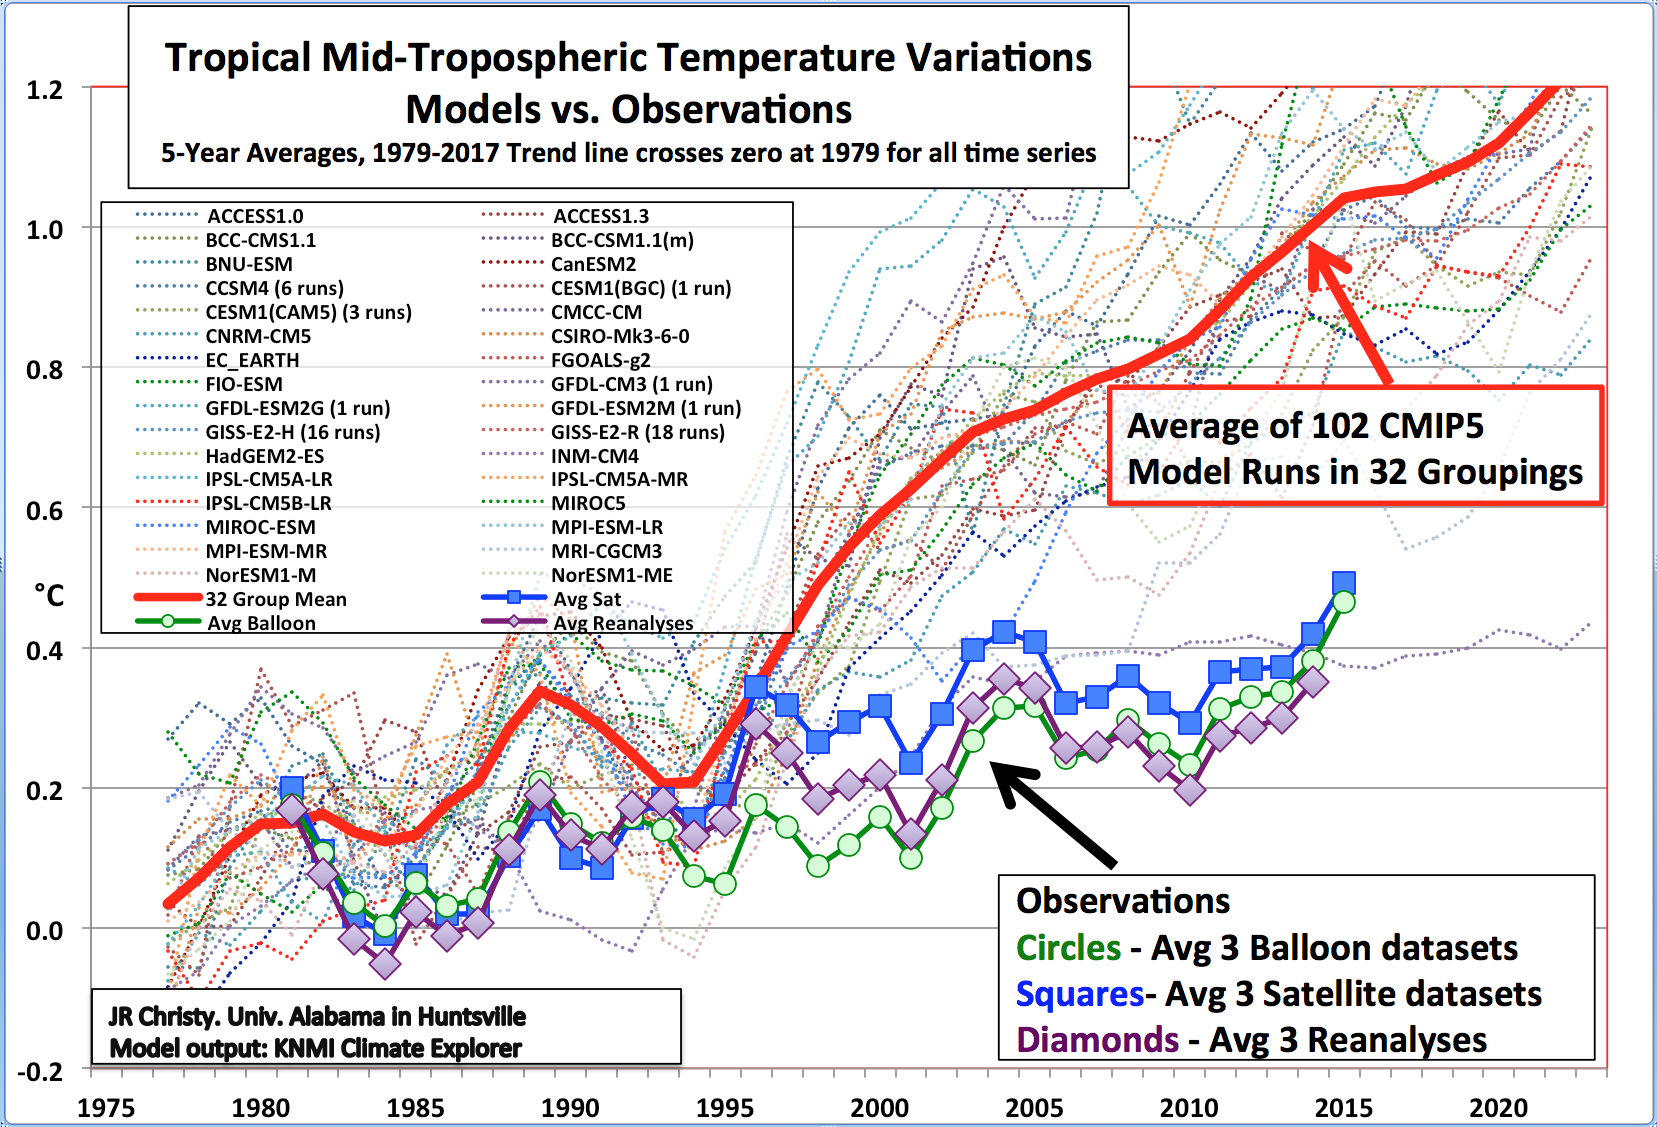
Slide 8: source John Christy and Roy Spencer.
Now if we have to summarize the global climate debate in one graph, it could be this one. Mainstream climate scientists don’t like it and try to explain away the differences it shows. Sceptics see it as evidence the models are ‘oversensitive’, that means, overestimating the warming effect of CO2.
Over the last few years the evidence for models being oversensitive has been piling up. Only in this decade has the increase in temperature and greenhouse gases since about 1850 become large enough, and the understanding of the influence of aerosols sufficiently good, to estimate with any confidence the sensitivity of the climate based on observations.
The main conclusion from these so-called observational estimates, and I share those, is that observations indicate a much less sensitive climate than the climate models. This is really good news. It means we will get considerably less warming in the future even if CO2 emissions will continue to rise, which is to be expected, since large parts of the world are still developing their economies and cannot do that without fossil fuels.
Extremes
Another topic of great societal importance is the occurrence of extremes. That the climate is getting more extreme, is a message we hear almost on a daily basis in the media. But is this so? It might surprise you but for the most consequential extremes in terms of damage and victims, the answer is a clear no. Hurricanes, floods and droughts have not gotten worse because of climate change. Here an example of trends in droughts [slide 9].
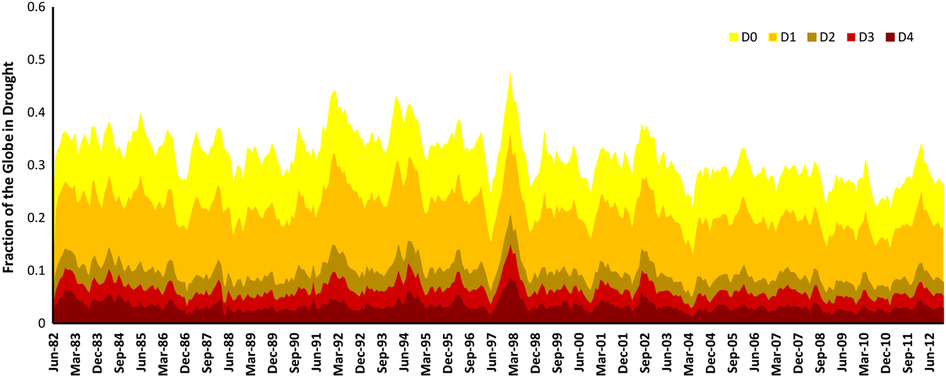
Slide 9: Hao et al, Nature (2014), https://www.nature.com/articles/sdata20141
And here for hurricanes [slide 10].

The number of people dying from natural disasters has declined dramatically in the past century [slide 11].
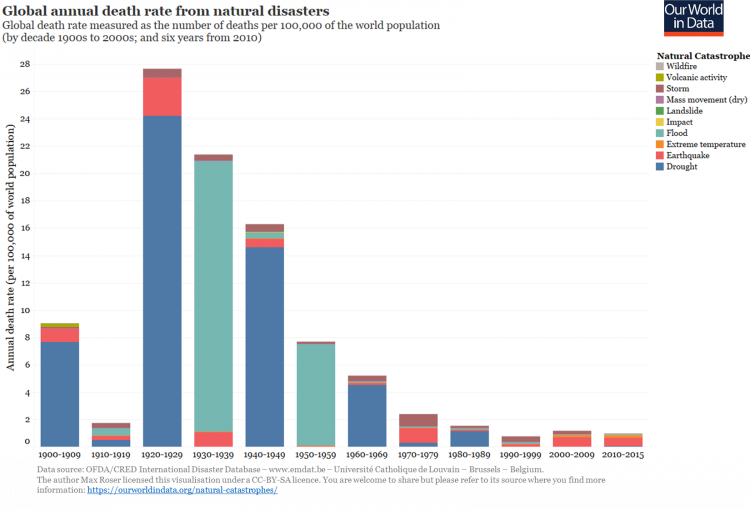
Slide 11: Our World in Data, https://ourworldindata.org/natural-disasters
This has everything to do with reduction in poverty. Better off people are less vulnerable for weather extremes.
The financial damage caused by extremes has increased but this is mainly because we have more and wealthier people so there is more property to be damaged. If you correct for this, there is no trend left, or even a slightly decreasing one [slide 12].
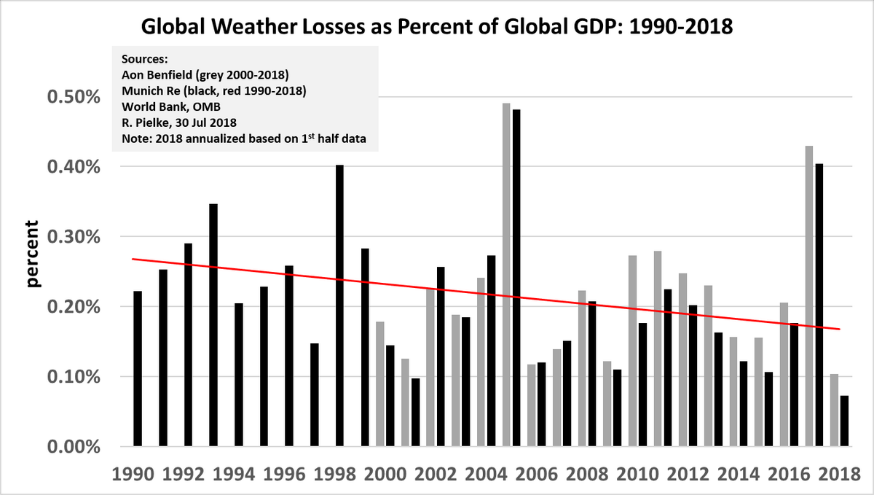
Slide 12: source Roger Pielke Jr.
Sea level
For us in Holland, sea level has always been a huge topic. We have experienced terrible floods in the past, for example in 1421, when the Saint Elisabeth floods killed an estimated 10,000 people. More recently of course we all remember the floods in Sealand in 1953 which killed almost 2,000 people. The sea level has been rising for the last 150 years or so, both globally and along our coast, but the rise has been remarkably steady throughout this period. [slide 13]
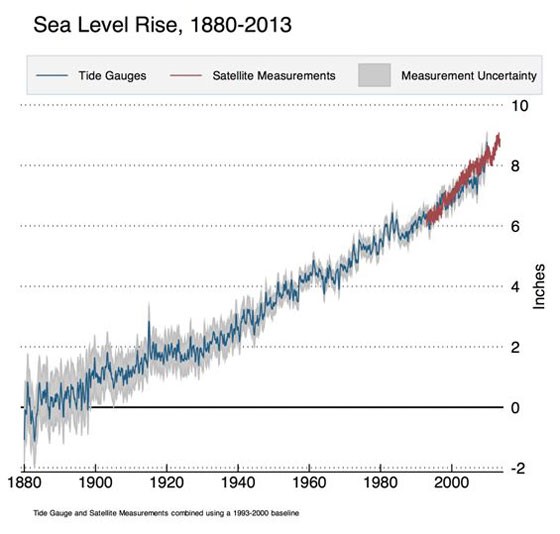
Slide 13: sea level rise based on tide gauges (blue) and satellite measurements (red). The rise in CO2 concentrations on the right.
You would expect an acceleration of the sea level rise after World War II when CO2 emissions start to increase rapidly. But so far, the evidence for this is weak. Satellite data show a somewhat quicker rise than historical tide gauges, but it is unclear whether tide gauges confirm this. But even the rise measured by satellites is at the bottom end of climate model scenarios.
Greening
The last thing I want to mention is the greening of the earth. [slide 14]
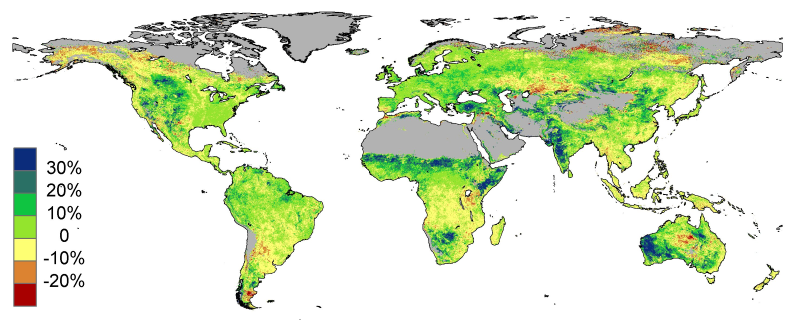
Slide 14: Donohue et al. (2013), GRL
What are you saying? Yes, the earth is getting greener and indeed, CO2 is causing this. After all, as you all know, CO2 is plant food, so more CO2 in the air means plants are growing faster and better. This also applies to food production. Last week Dutch climate economist Richard Tol said in newspaper De Telegraaf that for this reason climate change so far has probably been beneficial.
Doomsday
My next book will be titled “Is it really 5 minutes before midnight?” As I have just explained, there are many good reasons to think it isn’t, even if you accept, just like the IPCC, that all of the warming we have experienced is caused by CO2. The only exception is that I have more faith in observations than in climate models. Or in terms of the past and the future, I prefer to rely mainly on the past and I believe the past is not very alarming.
Nevertheless, in the media climate change is portrayed as the biggest threat of humanity. There literally exists a doomsday clock [slide 15] that currently says it’s 2 minutes before 12. This picture is from 2016.

Slide 15: The Doomsday Clock in 2016, https://thebulletin.org/doomsday-clock/
Where does this idea of doom and gloom come from? As you know, in Paris in 2015 all countries agreed that global warming from preindustrial levels should stay below 2 degrees Celsius. Now there is actually very little science behind the two degrees target but it is a hard political reality. The IPCC makes projections based on climate scenarios and if you take these seriously, then we will go over the 2 degrees threshold later this century. [slide 16]
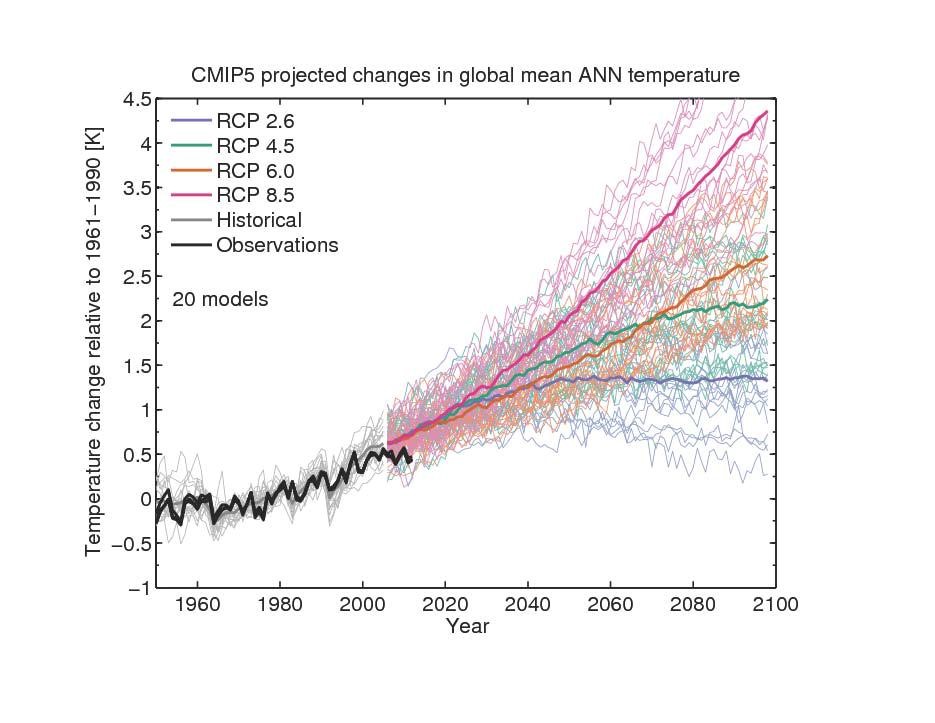
Slide 16: IPCC scenarios, published in the AR5 report (2013).
This is the main reason policy makers claim we are running out of time.
However, these projections are based on the same oversensitive climate models, we just discussed. The British scientist Nic Lewis, who published papers with observational estimates for climate sensitivity, recently calculated that the IPCC projections for these scenarios probably overestimate the warming in the 21st century by a factor of approaching two. I joked on twitter that the people in Katowice this week, who are doing climate negotiations, should take a good break and read Nic’s post. It’s good news, ladies and gentlemen, we have more time to get rid of fossil fuels.
Before I finish with some words about policy, I want to show this figure which actually is a good summary of our age. [slide 17]

This graph shows we live in a glorious age. Normally if a species explodes in numbers, this will lead to food shortage and starvation. Humans went from 1 to 7 billion in two centuries. And at the same time we have become much wealthier and healthier and we live longer. Yes, CO2 went up as a result of this development, which was intimately linked to harnessing energy from fossil fuels. There is no reason to believe, in my opinion, that CO2 can seriously change this glorious age.
However, I do believe that our policies in reaction to climate change can do serious harm. As they say, the cure can be worse than the disease. [slide 18]
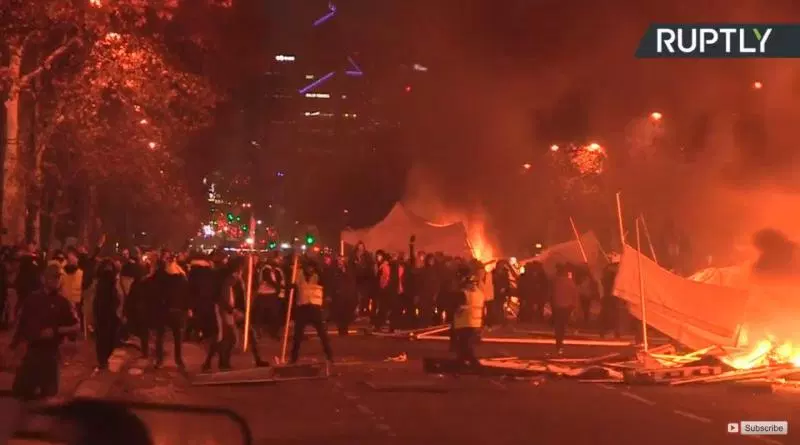
In France we have seen huge protests in the past weeks, organised by the yellow vests. The reason for their protests was a 7 cent tax increase on a liter of diesel. Six people died so far, hundreds are injured. The most famous quote from the protestors: “The elites are talking about the end of the world while we’re talking about the end of the month”.
In The Netherlands we learned this week that the energy bill for an average household will increase by around 300 euros in 2019. This is largely the result of climate and energy policies. A recent survey asked people how much they wanted to pay per month for climate policies. 30% said nothing at all, 23% said between 1 and 10 euros. Next year’s increase is already higher than this and this is only the beginning.
Society
Now what does this all mean for our personal life? People might be surprised to learn that I live as “green” as one could possibly live. I never had a car, I do everything by bike in Amsterdam. I came here by train. My daughter is the first junior bicycle mayor in the world. But is this because of climate change? No. This is just the lifestyle I like given my circumstances, I live in the centre of Amsterdam.
But there is no need to feel guilty if one owns a car.
Unfortunately, the positive view on the climate issue that I told you today is totally absent in government circles. You could say that climate negotiators live in a parallel universe that is built on the climate models. Perhaps this is the key element for fathoming the discrepancy between the virtual world of unrealistic models and the world you and I live in.
We as human beings should take care of our world in a meaningful way. This is a daily process that we need to figure out here and now, one step at a time. The envisioned grand and utopian future as modelled for us, not with us, spawns a dystopian threat we all know too well from the 20th century.
Politicians often think they can engineer society. Our current political leaders now even believe they can manage the climate. This is a dangerous utopian vision for which the bill is handed over to the citizens.
Thank you
Marcel Crok, science writer
Hoi Marcel, Als een van de weinigen – vermoed ik – ben ik het helemaal met je eens. David Siegel heeft hier ook een aantal interessante stukken over geschreven, zie: http://www.climatecurious.com/ https://medium.com/@pullnews/in-memory-of-hans-rosling-9116b88fc532 U en David maken in essentie hetzelfde argument, volgens mij. Schandalig dat een organisatie als TED zo’n presentatie dan in diskrediet wil brengen, terwijl u toch wel degelijk met echte data, en niet psuedowetenschap, uw punt onderbouwt. Het blokkeren van presentaties zou gebaseerd moeten zijn op de *intentie* van de spreker (de waarheid achterhalen, of net doen alsof), niet op de*uitkomst* van dit proces (al dan niet eens… Lees verder »
TED laat dus duidelijk zien bij wie ze op de loonlijst staan. Er is geen weg terug nadat je je ziel hebt verkocht aan de duivel.
Wie is er verbaast dat er een grafiek van John Christy and Roy Spencer in dit verhaal zit?
Je bedoelt “verbaasd” (ook als naamwoordelijk deel gewoon vervoegen). De modellen komen uit de KNMI Explorer database. Wat betreft satelliet data — één van de drie wordt door Christy zelf beheerd. In ieder geval zou het interessant zijn te vermelden wat er voorspelbaar is aan de grafiek. Deze gaat om de tropical mid-troposphere temperaturen en wat de modellen daarvan weergeven. Verwar het niet met het andere onderwerp: oppervlaktetemperaturen.
‘For us in Holland, sea level has always been a huge topic.’
Do you mean Noord Holland and/or Zuid Holland or should I read The Netherlands ?
Humanity only progressed because they found ways to obtain the energy needed easier and cheaper.
Society as we know it will fall apart if more and more people no longer can achieve the energy needed to survive.
But maybe that’s the goal of those who manipulate our puppet politicians. Wars and chaos have always benefitted those who want to control.
But part of The Netherlands sea level rise is sinking of the plate because of the scandinavian countries rising since the miles thick ice has gone that dominated the landscape during 90,000 years.
https://www.sealevelrise.com/?p=213
Marcel, what about the melting of the ice-caps and the glaciers? What about the loss of species? What about mass tourism? Why are shadows no longer sharp?
The melting and growth of ice caps – isn’t that a natural phenomenon? The Mendenhall gletsjer in Alaska melted away just to reveal …. a 1000 to 2000 year old three trunk, indicating that trees had actually grown there only this short time ago. Climate-relativism should be your attitude in the overhyped times of today, regardless of any pseudo-scientific hockeystick icon that is being thrown at you. Loss of species – we have a good article on that topic through our website. (link* below), but are suggesting a climate-anything relation? Mass-tourism; there comes the problem: do you really grant other… Lees verder »
Hoi Marcel, I share your concerns on the effect the policies have on the people of the Netherlands. Even if the models would be highly accurate, 10’s of billions of Euro’s for an effect of an estimated 0,000007% reduction in temperature change. That is a terrible deal and will most likely push even more people in to poverty and widen the gap between the rich and the poor, between the haves and have not’s. A often heard argument to push the climate measures anyway is: It is better then doing nothing at all. So it all boils down to a… Lees verder »
Indeed although I’m not opposed to trying out different or reformed systems, over time. Change happens, some experimentation and adaptation can bring many good things. Although in any complex system, the rate of change needs to remain modest. As for the terrible deal, it’s not just a leap of faith but I think it’s getting more and more clear that climate policies, at least in the Netherlands, have little reasonable basis at all. It seems entirely driven by other, mostly psychological motives. And entirely kept out of consciousness, outside the main conservation. Anyone attempting to re-introduce realism becomes not just… Lees verder »
Het gebeuren met TED is symptomatisch voor de PC ziekte. Hulde aan de lokale Roermond branche! Helden.
De PC ziekte is wat moet bestreden worden. Politieke Correctheid is een bepaald soort gedachtengoed met institutionele dreiging die er van uitgaat als dit wordt weersproken. Zelfcensuur wordt dan opgelegd omdat één partij dominant is in media en het tot moreel deugmens-symboliek is verworden om het klimaatparadigma en duurzaamheids-ondenken te omarmen.
Marcel, ga zo door.
Dit heet progressisme. Iedere partij of groep die dat woord in haar propaganda herhaaldelijk laad vallen moet worden vermeden/bestreden als de pest.
Energy bills? Look at water bills. Citizens are paying more than you think. There are two nonscience eco-fads involved in creating global warming/climate change. Both appeared in the mid-’80s and spread very quickly. Water saving water rates provide the “warming” in global warming, as well as the “variability” in climate change, complete with very high and low temperatures, fires and floods. These are desert conditions, caused by high unit rates on water depressing irrigation in and around cities around the developed world. The western parts of all continents tend to be dry, because they are next to a cold ocean.… Lees verder »
There is some good to get out of “climate emergency” policies – if someone would just point out how damaging millitaries around the world are to the planet.
Not only is this valid under the IPCCs assumptions (the Pentagon’s CO2 footprint is larger than several developed countries’ industries), it seems to be valid under anyone’s environmental assumptions i happen to talk to. A good way to figure a honest climate proposal from one with conflicts of interest, is the absence of accounting for millitary budgets – those are the Nr.1 places were funding for climate policies should come from.
Ik geloof dat verhaal niet beter dan het gebruik van bleekwater om het coronavirus weg te krijgen. Je zult afvragen wat hebben die twee met elkaar te maken. Veel. Daar is de hockeystick grafiek zo aangevallen door de US conservatieven in het congres maar zijn het niet diezelfden die geen getuigen wilden horen bij het impeachment proces. Dus heel geloofwaardig zijn ze niet. Ik heb het niet opnieuw herlezen maar herinner me dat de wetenschappelijke discussie over de dikte van de boomringen eigenlijk ging over het weer in 1350 ofzo. De grafiek werd voorgesteld als de kern van het climaatdebat.… Lees verder »
This is a pretty simplistic conclusion, I know we’ve done great in the past. But as they say: behaalde resultaten geven geen garantie voor de toekomst – results of the past are give no grantees for the future. “This graph shows we live in a glorious age. Normally if a species explodes in numbers, this will lead to food shortage and starvation. Humans went from 1 to 7 billion in two centuries. And at the same time we have become much wealthier and healthier and we live longer. Yes, CO2 went up as a result of this development, which was… Lees verder »