
Nic Lewis has published a lengthy and quite technical response on a recent Met Office report, see the posts at Bishop Hill and Judith Curry. His response will hit the Met Office like a boomerang.
Boomerang
Why like a boomerang? In July the Met Office published three reports about the ‘pause’. In the third and I would say most important one they looked at the implications of the pause for estimates of climate sensitivity and projections of future warming. Their key conclusions were (see their concluding remarks):
Despite the fact that the first decade of the 21st century has been a period during which there was very little global mean surface temperature rise, the range of TCR [Transient Climate Response, MC] estimates from the CMIP5 models lies within the TCR derived from observations, including this period.
When projections from the newer CMIP5 models are combined with observations, and specifically including the surface temperatures from the last 10 years, the upper bound of projections of warming are slightly reduced, but the lower bound is largely unchanged. More importantly, the most likely warming is reduced by only 10%, indicating that the warming that we might previously have expected by 2050 would be delayed by only a few years.
In simpler words, Met Office claims the recent pause in global warming has had little impact on estimates of climate sensitivity and future warming and models and observations largely agree with eachother. Met Office backed this up with several figures. Below I show their figure 5, showing estimates for Equilibrium Climate Sensitivity (ECS), which is the warming due to a doubling of the CO2 concentration, after the system has reached a new equilibrium.
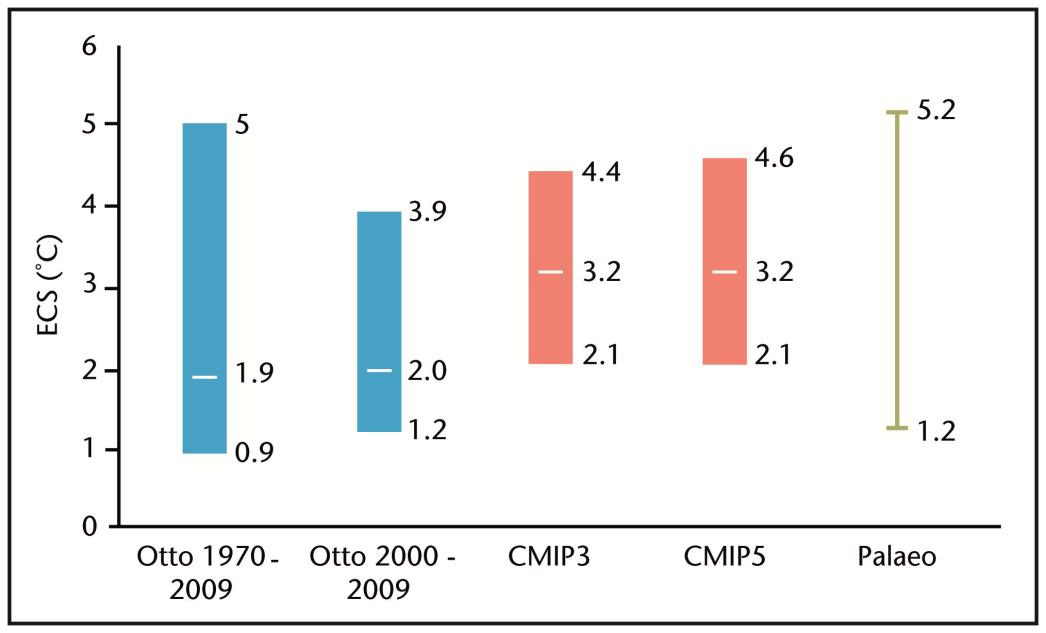
- Met Office figure 5
Otto et al is a recently published study that estimated climate sensitivity from observations. Visually the message is clear: there is a huge overlap between Otto et al (observations), CMIP3 and CMIP5 (the models) and palaeo estimates. Models therefore are ‘consistent with’ the observations, which is important to have faith in their projections of future climate. Nic Lewis was a coauthor of the Otto et al paper together with a large group of lead authors of the upcoming AR5 report. Lewis wrote the response in a personal capacity.
Now to make a long introduction short, here is Lewis’ adjusted version of the Met Office figure 5:
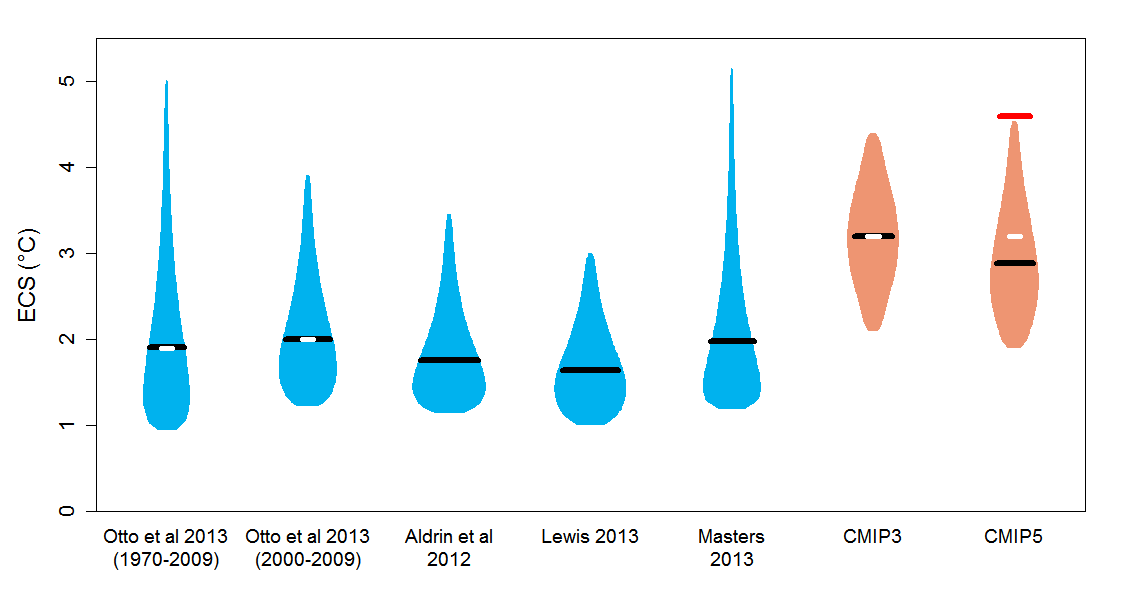
Lewis added other recent estimates of ECS based on observations (Aldrin, Lewis, Masters), he removed the palaeo estimates (as these are far too uncertain and contain “little information”) and he used flasks to show the 5-95% range of the distribution. The black bars are Lewis’ best estimates (medians). The white bars are the Met Office best estimates, for CMIP3 and 5 Met Office used the means instead of the medians.
The “boomerang” is the red bar on top of the CMIP5 distribution. This is the ECS of Met Office’s own flagship HadGEM2-ES model. As one can clearly see Met Office’s own model is not only far more sensitive than the observations suggest but even more sensitive than all other models. As Lewis put it:
And HadGEM2-ES has an ECS that exceeds not only the 95% bound from Otto et al but also that from two other recent observationally-based studies. Moreover, both the TCR and the ECS of HadGEM2-ES exceed the 95% bounds derived not only from CMIP3 models but also from CMIP5 models other than HadGEM2-ES.
So the Met Office model’s best estimate lies outside the range of both the observations and all the other models. It is a clear outlier. Met Office failed to disclose this in their own report, only showing the range of all the models in their figure 5 (and in other figures).
Relevance for the upcoming AR5 report
Although Lewis’ response is directed at the Met Office report, his piece is also highly relevant for the upcoming AR5 report. In an article today in the Wall Street Journal Matt Ridley quotes from the leaked SPM of AR5 (my bold):
Specifically, the draft report says that “equilibrium climate sensitivity” (ECS)—eventual warming induced by a doubling of carbon dioxide in the atmosphere, which takes hundreds of years to occur—is “extremely likely” to be above 1 degree Celsius (1.8 degrees Fahrenheit), “likely” to be above 1.5 degrees Celsius (2.4 degrees Fahrenheit) and “very likely” to be below 6 degrees Celsius (10.8 Fahrenheit). In 2007, the IPPC said it was “likely” to be above 2 degrees Celsius and “very likely” to be above 1.5 degrees, with no upper limit. Since “extremely” and “very” have specific and different statistical meanings here, comparison is difficult.
Still, the downward movement since 2007 is clear, especially at the bottom of the “likely” range. The most probable value (3 degrees Celsius last time) is for some reason not stated this time.
Apparently IPCC is planning (countries will negotiate about the final text in Stockholm later this month) to lower its likely lower bound for ECS from 2.0 in AR4 to 1.5 in AR5. By doing this the median estimates based on observations shown in the Lewis’ figure above fall into the likely range. So this rightly reflects the recent literature.
However, less assuring is that Ridley reports that in the draft SPM “The most probable value (3 degrees Celsius last time) is for some reason not stated this time”. As can be seen clearly in the Lewis’ figure, all the recent most probable values based on observations lie between 1.5 and 2. The central estimate of the models is 3. Or as Lewis put it into his conclusions:
Observationally-based median estimates for TCR and ECS are often comparable to the bottom of model-based uncertainty ranges.
This means that only the least sensitive models come close to the observations. Now this generates a big dilemma for the IPCC authors which could explain why so far – in their draft SPM – they failed to mention a best estimate for ECS. Recently there has been is a growing discrepancy between observationally based estimates and model based estimates for ECS. Should IPCC give equal weight to both methods? Should IPCC average the central estimates of both methods (leading to a reduced new estimate of let’s say 2.5)? Or should they put most weight onto the observations? In the last case they should lower their best estimate to at least 2. That would be a spectacular result as the best estimates for ECS hardly changed at all since the 1979 Charney report.
I hope many countries (including my own) will urge the IPCC to publish a best estimate for ECS (like they did in AR4) or – in case not – to clearly explain why they decided not to mention it this time. I see this as one of the most if not the most important decision for the four day meeting in Stockholm. On 27 September we will know the answer.
228 reacties. Klimaat verandering leeft niet meer onder de bevolking
http://www.telegraaf.nl/watuzegt/21889469/___Milieu-_en_klimaatleugens___.html
Belastingen, Armoede, Energie kosten, Werkloosheid,Onbetrouwbare politici etc is wat Nederland bezig houdt.
1159 reacties
http://www.telegraaf.nl/binnenland/21891164/__Wilders_valt_Rutte_hard_aan__.html
Steeds meer Nederlanders zijn aan het overleven. Laten we hopen dat we niet weer een koude winter krijgen dat zou voor veel gezinnen funest zijn.
Thanks Marcel for highlighting another nice piece of detective work by Nic Lewis. I have two comments 1) I would not dismiss the paleo data so easily. Yes, the data is uncertain but at least it gives insight into some of the feedbacks that operate on longer timescales which may not be captured by the observational time series we have. 2) In your book you mentioned that in your opinion there are two ’truths’ in climate science; the increase in temperature over the past century and the increase in atmospheric CO2 concentration due to fossil fuel combustion and deforestation. For… Lees verder »
Guido thanks for your comment! ad 1) what I understand from Nic Lewis is that the uncertainty in especially the forcings is so great that the resulting pdf’s are very broad. See Ch 10 of AR5 ad 2) I agree that some part of the warming must be due to greenhouse gases and if that is important to you I could have written that in 2010 as well. However this solves very little, because is it 10% or 30% or >50% or even more than 100% (meaning that without aerosols it would have been more)? I still tend to believe… Lees verder »
Thanks Marcel – points well taken, except that imho it is difficult to defend an anthropogenic contribution of 10 or even 30%. I fully appreciate the uncertainties, but even with a low climate sensitivity and minor role of aerosols you get a more substantial contribution. However, there is some circularly reasoning if the CS is based on the temperature record I guess.