The shift in the Central Netherlands Temperature in 1987
My first peer reviewed paper is out. The full title is: A Late 20th Century European Climate Shift: Fingerprint of Regional Brightening? First author is Jos de Laat of KNMI. The idea for the paper was mine, but Jos certainly did most of the work. The paper is freely available on the website of the journal Atmospheric and Climate Sciences.
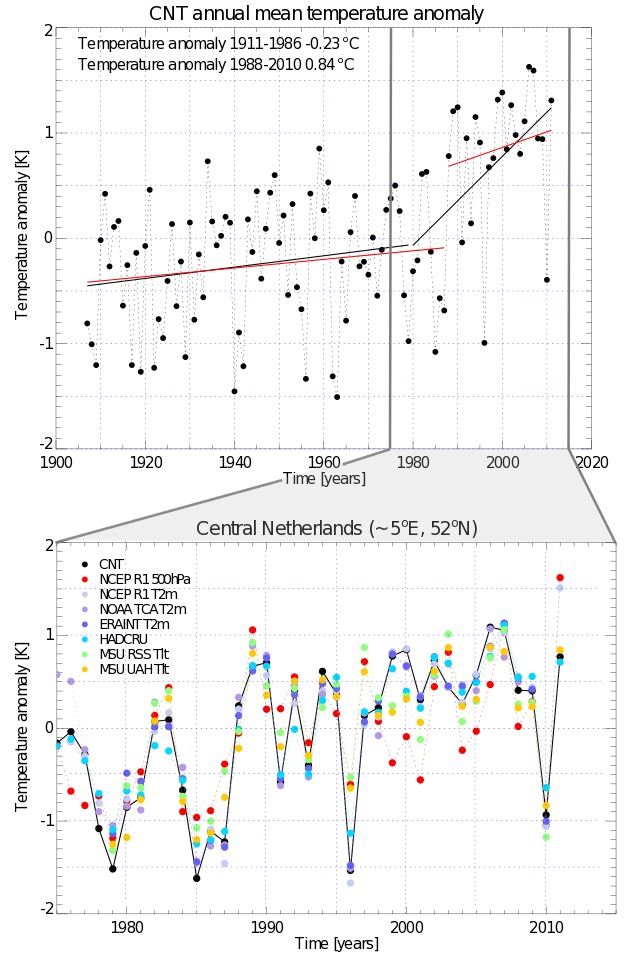
For some years I noticed just by visual inspection that in the eighties there seems to be a jump in the Dutch temperature time series. I asked Jos to have a look at it. He spent some time selecting the ‘best’ method to determine whether this shift is ‘real’. This so called change-point analysis procedure concluded that indeed there is a very significant step change of about 1 degree Celsius in the Central Netherlands Temperature time series in 1987.
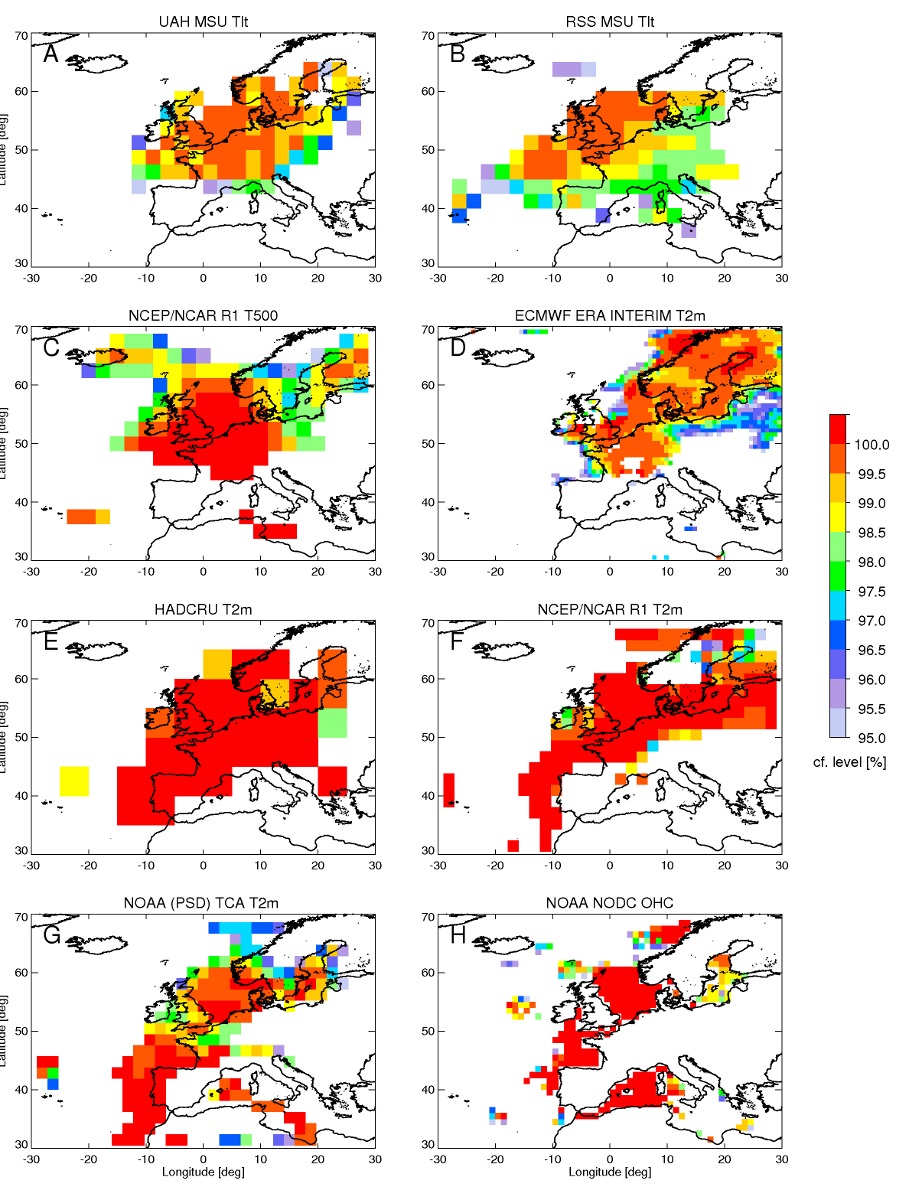
The next step was to look for the spatial pattern of the shift. We also used investigated other datasets like the satellite series UAH and RSS. We found the shift all over western Europe and in all the different datasets we studied as can be seen in our figure 2:

Spatial pattern of the shift in ’87/’88 in different datasets
Dimming and brightening
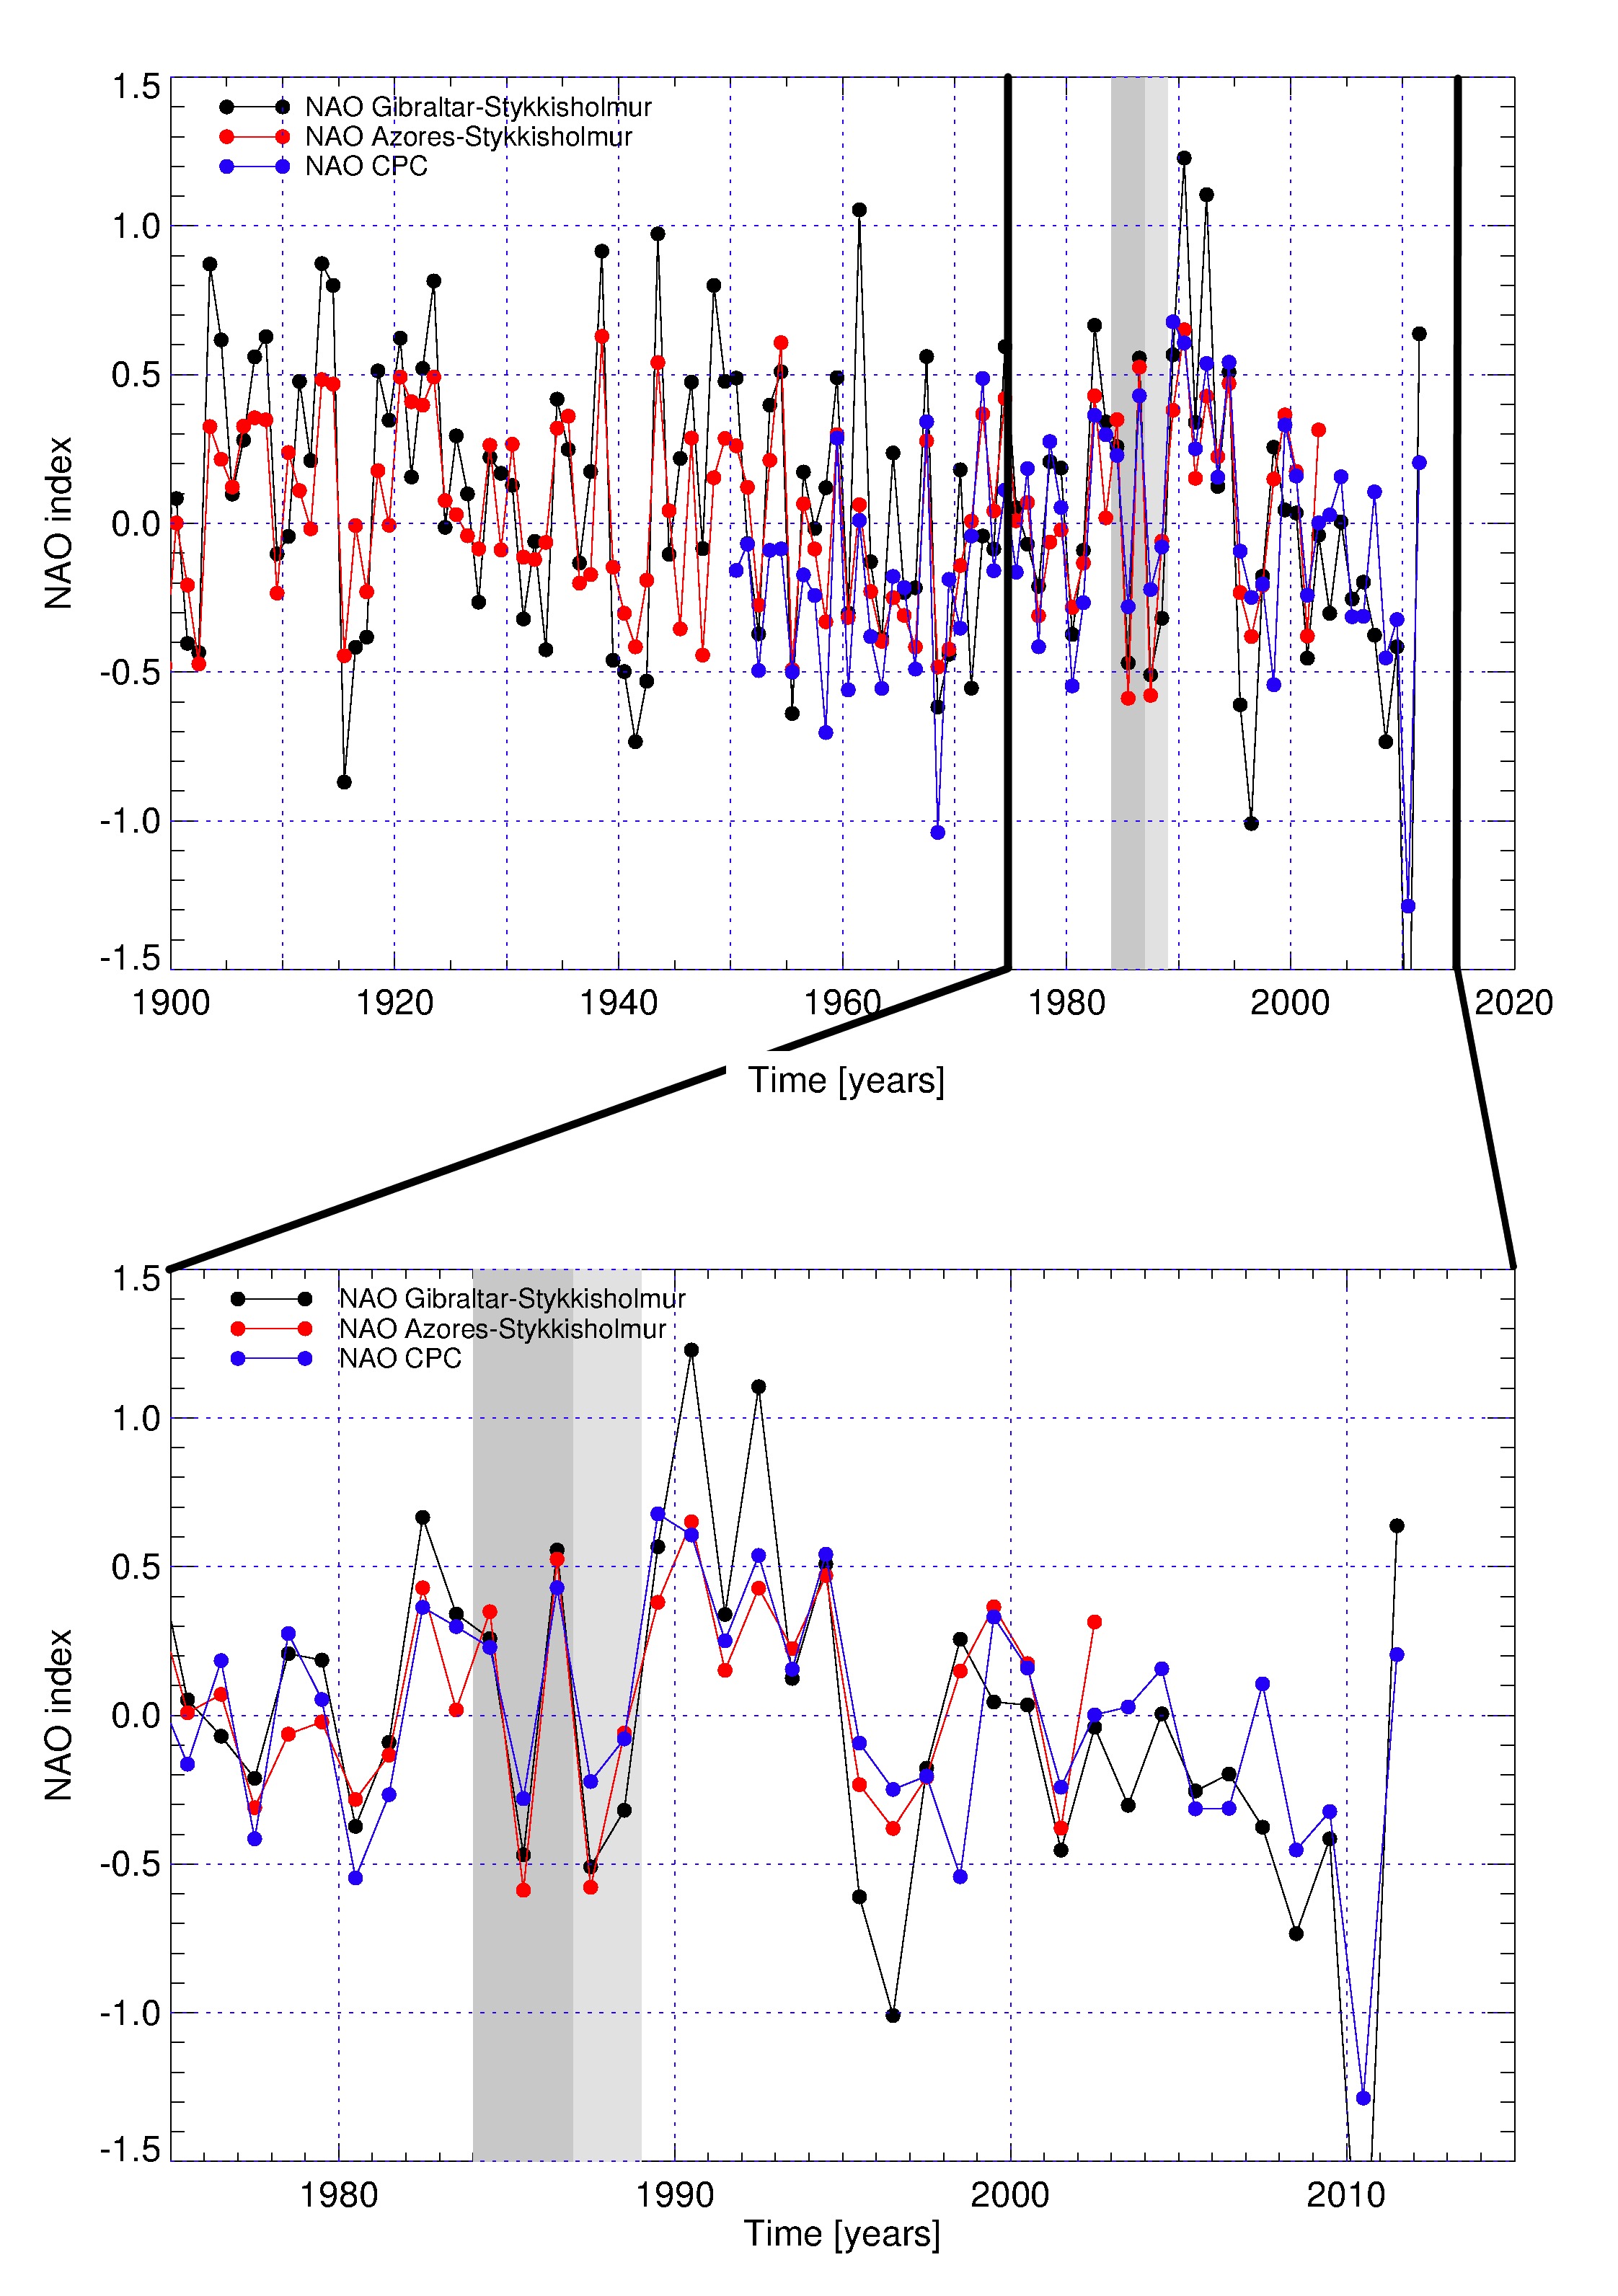
We regard the documentation of this European wide shift in 1987/1988 as the main result of our paper. Now of course the next logical question is what caused this shift and is it consistent with greenhouse warming? The shift coincides with a change in the North Atlantic Oscillation, which we show in our figure 4:
However when the NAO gets back to average values, the temperature in Europe stays at the higher level. Several papers (see our references) have shown that up to 50% of the recent warming in Europe could be the result of brightening, i.e. more sunlight reaching the earth surface. Global dimming (between the fifties and the eighties) and subsequent brightening (starting in the eighties in Europe, supposedly as a result of environmental regulations) are well established by measurements all around the world. Martin Wild and Atsumu Ohmura of ETH have been publishing a lot about this topic.
The years 1984-1986 were quite cold in Europe, several years after the shift in the NAO were quite warm. This period coincides with the change from dimming to brightening. We therefore argue in the paper that the shift could be considered as a fingerprint of European brightening.
So it is certainly too early to state that the shift we have ‘found’ is inconsistent with greenhouse warming. The generally accepted view is that dimming compensated for the greenhouse forcing in the 50-ies to the 80-ies. As a result the warming due to greenhouse gases didn’t become ‘visible’. Then in the eighties the air in Europe became cleaner, more sunlight reached the ground (the amount of extra sunlight is huge, in the order of 10 W/m2). As a result Europe has been warming twice as much as the global average (1.5 degrees instead of globally 0.8).
However, on the other hand, since 1992 there has been no further warming in The Netherlands, as is shown in this graph on the blog of Rob de Vos:
This leads to the intriguing fact that the warming in The Netherlands seems to be limited to a very short period between 1987 and the early 90-ies. After that both greenhouse forcing and brightening still increased but this didn’t result in further warming in The Netherlands.
[Update: Comments by Jos Hagelaars and Rob de Vos make clear this is not correct. There still is some warming after 1992, in the order of 0.2-0.3 degree/decade.]
Climate Dialogue
Some people might find it surprising that a Dutch scientist of KNMI publishes a paper with a Dutch science writer (who is regarded as a critic of the IPCC consensus). For me of course it is not. I met Jos for the first time when I worked on my hockey stick article in late 2004. Throughout the years we have had many interesting discussions about climate science. He is also part of the advisory board of Climate Dialogue, the discussion platform that KNMI, PBL and I have set up last year. This paper is written in the spirit of a climate dialogue you could say and I applaud KNMI for accepting this somewhat unusual cooperation.


Hello Marcel, congratulations with your paper. The changes in the temperature of the Netherlands and surroundings are surely interesting. I read in the paper that autocorrelation in the data could have influenced the statistical significance: “This lack of stability indicates that for the time series at hand—non-stationary, autocorrelated and containing one change point— the block-bootstrap is not a suitable method for change point detection.” Does this mean that the statistical significance of this ‘shift’ could also be due to coincidence ? I do not think it is correct to state that since 1992 there has been no further warming in… Lees verder »
Ik heb hier met Aarnout van Delden (maar dan als klein onderzoekje in NL) al eerder over geschreven in Weather: http://onlinelibrary.wiley.com/doi/10.1002/wea.854/abstract. Mooi dat dit nu in groter verband ook is bekeken.
Ik zal het artikel binnenkort eens doornemen.
MvG,
Arjan van Beelen
I get a slope of +0.20 °C/decade
Means +0.02C annualy (is this within the error bars?). Reminds me of the butler who was fired because his masters bath was 37,5C instead of 37C.
Above graph of De Bilt temp runs up to april 2013. For the period 1-1-1992 to 31-12-2012 the trend is +0.63°C for the whole period (0.3°C/decade) . For the period 1-1-1998 to 31-12-2012 the trend is -0.09°C (-0.06/decade). So after the uptick between 1988-1991 there still has been some warming up to 1998. From 1998 onward De Bilt shows no further temp increase.
Hi Jos and Rob, thanks for the comments, update added to the text.
Jos, your other remark refers to the “block-bootstrap” which we explain we didn’t use after all.
Marcel
Congratulations to both Marcel and Jos! Nice to see such a collaboration, revealing some aspects of the true complexity of climatic influences. I would like to add some remarks. You use the term “spurious” to characterise the temperature shift. In statistics, spurious relationships occur when not-related non-stationary time series show comparible time trends. The temperature shift might indeed be attributed to “brightening”. Recently Martin Wild has published a fine readable article (Bull. Amer. Meteor. Soc., 93, 27–37, http://www.iac.ethz.ch/people/wild/WildBAMS_2012.pdf) on the backgrounds of the dimming-brightening, with comparable thoughts on the temperature developments in the eighties. Wild too shows the temperature shift,… Lees verder »
Dank je Marcel om het ook via Facebook dit ons in België te brengen. Uw cijfers lijken ook overeen te stemmen met wat ik zag in statistieken van zonnepaneelinstallaties, hoewel ik daarvoor geen cijfers heb van voor 1990. Uw methode lijkt nu erg goed op deze van onze ‘heel oude Nederlander’ Easton, van wie ik het ORIGINELE boek dat in http://onlinelibrary.wiley.com/doi/10.1002/qj.49705522921/abstract besproken wordt, thuis liggen heb. M.a.w. uitermate objectief: eerst en boven alles cijfergegevens, en dan heel helder (zoals het zonlicht vanaf 1990) de mogelijke veronderstellingen en de daarna ondernomen acties om te zoeken hetzij naar correlasties, hetzij naar causale… Lees verder »
Rob de Vos sent me two graphs for De Bilt, one from 1992 and one from 1998:
Marcel, thanks for your reply. I re-read that part about the block-bootstrap and I did not interpret it correctly. I apologize. That section of the paper begins with: “One of the reasons that our statistical analysis results in such a high significance may be that autocorrelation properties of the time series is not preserved using the classical bootstrap method.” Am I correct that autocorrelation could give you a statistical significance that could be too high and because of that you tested the block-bootstrap method, which didn’t give results you can trust? Will this be examined in a possible follow-up paper?… Lees verder »
Hi Marcel,
I showed in 2005 here this important jump in temperatures measured at our national Luxembourg Findel weatherstation in a graph which gives mean anuual surface temp. as a function of “global” CO2 (see last figure). You clearly can see the temperature step also
in this graph from meteolux .
Compliments for the paper!
Francis
[MC: thanks Francis, I added the graph below]

Hi I am so delighted I found your weblog, I really
found you by mistake, while I was browsing on Digg for something else,
Anyhow I am here now and would just like to say many thanks
for a marvelous post and a all round enjoyable blog (I
also love the theme/design), I don’t have time to look over it all at the
moment but I have bookmarked it and also
added in your RSS feeds, so when I have time I will be
back to read a lot more, Please do keep up the great work.